
Scaling software to optimally utilize resources on a multi-processor system can be challenging. In this article, I will discuss how we used custom locks to achieve good scaling in VeloxDB.
Before going into the details of this article, let me briefly introduce VeloxDB. Chances are, this is the first time you're encountering this database, but prior knowledge of VeloxDB is not necessary to understand the concepts discussed here. Cache line contentions and the locking mechanisms explained can be applied effectively in other projects too.
VeloxDB is an open-source, fast, object-oriented, in-memory database designed for C#, with a strong emphasis on correctness. It achieves a remarkable rate of 2.5 million write transactions per second while ensuring strict serializability. Interacting with the database in C# is similar to working with an object-relational mapper (ORM). If you want to learn more about VeloxDB, I suggest you check out my introductory article.
CPU Cache
First, let's cover some basics of how CPU cache works because it is important for multicore scalability.
As modern CPUs have become faster, the speed at which they can access memory has not kept pace. This discrepancy in speed is commonly referred to as the CPU-Memory gap. To address this gap, CPUs employ multiple layers of caches positioned between themselves and the main memory. Each layer of cache closer to the CPU is smaller, faster, and more expensive than the previous layer. A modern x86 CPU has three layers of cache called L1, L2, and L3, respectively. L1 and L2 are per core caches, while L3 is shared. For example, the Intel i7 13700K (a 2022 processor) has 80k of L1 cache, 2MB of L2 cache and 30MB of L3 cache.

When the CPU requests the data from the memory, it first checks L1 cache to see if the requested data is there, and then L2 and L3 in the end if all caches fail, it goes to the memory for data. The fetched data is then stored in all caches for subsequent access. The data is always fetched in chunks known as a cache line, even if cpu has requested less data, the whole cache line is brought into the cache. The most common cache line size is 64 bytes.
The CPU cache has become much more complex with the introduction of multicore CPUs. Multicore CPUs have per-CPU caches (L1 and L2 are on the core, while L3 is shared). If multiple cores fetch the same cache line and one of them updates it, this change needs to be synchronized across multiple cores. The smallest unit of synchronization is a cache line. When multiple cores access the same cache line, this can cause significant performance degradation and is called cache line contention.

Here is a small C# program demonstrating cache line contentions:
static void Count(int index)
{
    Stopwatch sw = Stopwatch.StartNew();
    while(sw.ElapsedMilliseconds < timeLimit)
    {
        counters[index]++;
    }
}

private static void Main(string[] args)
{
    Thread[] threads = new Thread[Environment.ProcessorCount];
    counters = new long[threads.Length];
    for (int i = 0; i < threads.Length; i++)
    {
        threads[i] = StartThread(i);
    }
    Wait(threads);
    Console.WriteLine(counters.Sum() / 1000000.0);
}
Let's create a straightforward example to illustrate this concept. Imagine a program designed to increment a number as rapidly as possible. To make optimal use of modern multicore CPUs, we will assign each core the task of incrementing its own counter. Once the threads have completed their tasks, we will aggregate the results.
We'll test the program's scalability by running it on 32 core machine (AWS EC2 c6a.8xlarge) with a varying number of threads, ranging from 1 to 32.

Here are our results, and you can see that they are less than satisfactory. While the code does show some scaling, it achieves only a 3.5x scaling with 32 cores. Additionally, you can observe some unusual behavior on the chart where, by adding more cores, we are actually experiencing a decline in performance.
What's occurring here is cache line contention. Remember that a cache line consists of 64 bytes and can hold 8 64-bit integer values. In our array, every set of 8 integers shares a single cache line, which leads to frequent synchronization among the 8 cores. Essentially, you have 4 groups of 8 cores working concurrently, fighting with one another for access to a single cache line. This accounts for the scaling factor we observe, approximately 3.5x.

Let's attempt to address this issue. We can make our array more sparse, giving each counter 64 byte chunk of an array so that each counter gets a dedicated cache line.

And this is what we get:
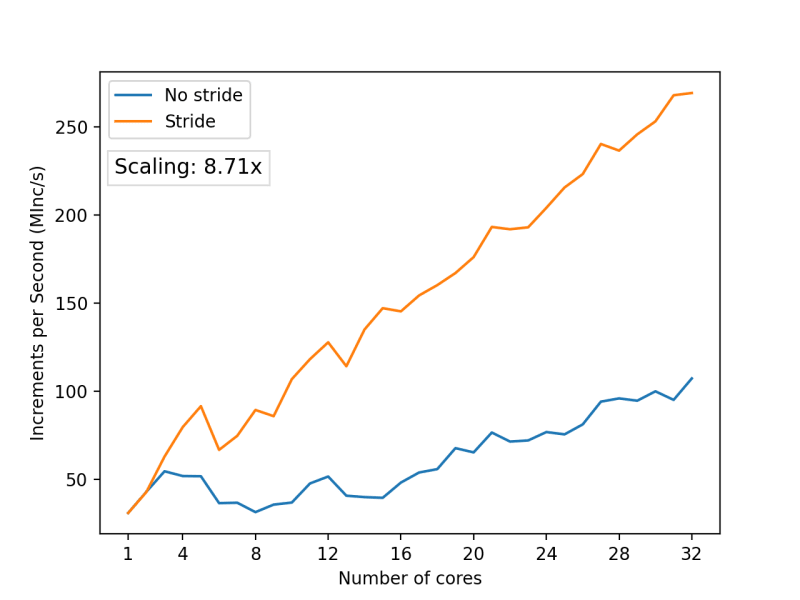
We've achieved a scaling factor of 8.71x, which is more than twice the improvement over the initial version. However, it still seems like a 32-core CPU should be capable of even better performance. What's even more indicative of an issue here is the fact that we still observe irregularities in the graph—instances where adding more cores actually leads to a performance drop. These are challenging problems to troubleshoot, and there is no single approach to solving them. In my case, I identified the issue by disassembling the code and carefully analyzing what was happening. Profiling with a sampling profiler might also help because it can show code spending an increased amount of time at memory access points where contention occurs.
It turns out that C# is at fault here, and our previous understanding of how an array is structured in memory isn't entirely accurate. C# prefixes each array with its length, which is a common practice in high-level languages.

This length information is then used to check for index out-of-bounds errors each time the array is accessed. This is where our contention issue arises. The array's length is located on the same cache line as the first counter. The first core continuously updates its counter, while all other cores access the array length, which results in cache line synchronization across all cores.
To resolve this, we will simply skip the first 8 integers in the array and start placing our counters after them. This way, we ensure that array length has its own cache line.
And these are the results we obtain:

A 30x scaling, which represents almost a 4x improvement over the previous iteration. The graph also no longer exhibits performance drops as seen previously.
The purpose of this example was to illustrate how fickle scaling on multi-core processors can be. Even when your threads do not share data, accessing adjacent memory can lead to significant performance drops. This highlights the importance of testing how your code scales.
VeloxDB's HashTable
Now that we understand the cache line contentions, I'll take a quick detour to showcase VeloxDB's main data structure. This is important because it provides the context in which these locks operate and offers a better understanding of the problems we were trying to solve with them.
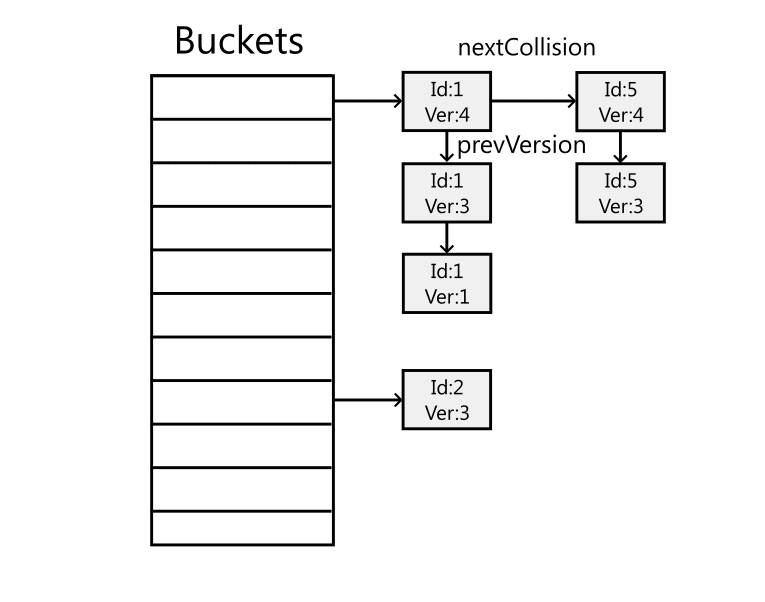
Each database table is represented by a hash table that maps a 64-bit object ID to the corresponding object. The hash table is implemented using unsafe C# and stores data in unmanaged memory. This was done to achieve better control over memory layout, especially for alignment, and to reduce the pressure on the garbage collector. The hash table needs to be thread-safe because it is accessed from multiple threads.
It also needs to be scalable, meaning that adding more cores should improve performance.
Multiprocessor RW Lock
So let’s first look at a lock specifically designed for multiprocessor systems. We use it for resizing the hash table. Resizing is a costly operation that must be performed under lock. Usually, when you need to resize a hashtable, you create a bigger storage array for buckets and then transfer items from the old buckets to the new, larger array. While .NET's ReaderWriterLockSlim is an option, we can improve upon it.
Hash table resizing is relatively rare and expensive, while accessing the hash map is common and fast. In multiprocessor systems, as we have seen, minimizing shared data across threads is ideal, as synchronizing data across cores incurs penalties. Using a standard reader-writers lock would create contention where none existed before. To avoid this, we implement a custom lock consisting of multiple locks, with each lock assigned to a specific processor and occupying a single cache line. The number of locks corresponds to the number of logical processors. For read lock (access), only the lock assigned to the current processor is locked, avoiding contention with other processors. For write lock (resizing), all locks are acquired. This approach allows fast hash map access by avoiding contention for read lock acquisition, while the slower write lock acquisition is insignificant compared to the resizing operation.


Here is a comparison between our Multiprocessor RW lock and .NET's ReaderWriterLockSlim. The benchmark measures the number of times a lock can be acquired in millions of acquisitions per second. The benchmark is repeated with varying numbers of threads. Notice how our lock's read performance scales and improves with each additional core, while the standard RW lock becomes slower. Conversely, the write lock is slower than the standard library lock and exhibits similar scaling behavior. For our use case, the benefits of improved read lock performance far outweigh the performance impact of the write lock.
If you want to take a deeper look, you can find our implementation of this lock here. Note that this implementation does a bit more than just the basic locking described here.
0-bit spinlock
Now, I'd like to introduce another lock that we employ: the 0-bit spin lock. To achieve effective parallelism, we aim to use fine-grained locks, locking only the minimal data for the shortest possible time. We utilize this lock for accessing the hash table's buckets, which means that only hash collisions or concurrent access to the same row can lead to lock contention. As we employ one lock per bucket, the number of locks scales proportionally with the number of rows in the database.
In .NET, any object can serve as a lock, but there's a 24-byte overhead associated with each object on the x64 platform. This doesn’t scale well to our number of locks, it would introduce significant memory overhead and increase strain on the garbage collector, to avoid avoid this, we've implemented our own spinlock that effectively doesn’t consume memory.
void EnterLock()
{
    while(true)
    observedState = state;
    if (GetBit(observedState, LOCK_BIT) != LOCKED)
    {
        // Calculate lock state with lock bit set
        lockedState = SetBit(observedState, LOCK_BIT, LOCKED)
        if (CompareAndExchange(ref state, lockedState, observedState) == observedState):
            return; // Lock acquired
    }
}
When reading from a bucket or adding a new element, we lock the bucket to prevent concurrent modifications. Here is the pseudocode illustrating the lock's function. The lock relies on the CompareAndExchange atomic operation. It updates the state value with the lockedState value if the state is equal to the observedState. This operation is provided by the platform and is guaranteed to be atomic. Our lock continuously spins until it observes the lock in an unlocked state. It then attempts to set the bit with the compare-and-exchange operation. If it succeeds, we have the lock. This is a spinlock, which actively utilizes the CPU during the waiting period. However, since lock contentions are expected to be infrequent and the tasks performed within the lock are minimal, it is acceptable to use it in this situation. Now, this lock obviously uses a single bit, although I consistently refer to it as a "0-bit" lock. We employ an additional trick here. Because our data resides in unmanaged memory, giving us control over how everything is allocated, and since we allocate buckets at 8-byte boundaries, it guarantees that the lowest 3 bits of a bucket’s pointer are always set to 0. We utilize one of these bits for the lock, effectively amortizing the memory cost of the lock and rendering it effectively a "0-bit" lock.
Takeaways
In this article, I've shown techniques used in VeloxDB for improving parallelism. Additionally, I'd like to point out something that may not have been apparent from the article: not all of our code is this heavily optimized. We don't employ unmanaged code in all cases, nor do we bit-pack every variable. A substantial portion of VeloxDB resembles typical C# code.
In the context of low-level optimization, two critical heuristics should be kept in mind: first, prioritize hotspots and avoid spreading complexity. If the complexity increase from optimization spreads beyond the targeted hot spots, it can lead to unintended consequences, such as decreased maintainability, increased risk of errors, and degraded performance. Therefore, it's crucial to manage the complexity increase carefully and avoid introducing complexity where it's not needed.
With the disclaimer out of the way, here's my advice:
Don't assume that you can't do better than the standard library. While the standard library is undoubtedly useful, it's important to remember that it's designed to handle a wide variety of use cases. As such, your specific use case may offer some unique performance opportunities that you can capitalize on.
When building code that needs to scale, it's important to keep contentions in mind.
Ideally, scalable code should share nothing, but this is rarely possible in practice. Therefore, it's crucial to minimize contentions to the best of your ability.
Relieve the pressure of the garbage collector in performance-critical paths of your code. Moving data to unmanaged memory might be overkill for most applications, but there are other techniques, like object pooling.
If you find this article interesting, check out my other articles. Also make sure to visit VeloxDB on GitHub.

Top comments (0)