
There is no better way to try Zebrium machine learning incident detection than with a production application that is experiencing a problem. The machine learning will not only detect the problem, but also show its root cause. But no user wants to induce a problem in their app just to experience the magic of our technology! So, although it's second best, an alternative is to try Zebrium with a sample real-life application, break the app and then see what Zebrium detects. One of our customers kindly introduced us to Google's microservices demo app - Online Boutique.

This blog will show you how to install and break the sample app using a local minkube Kubernetes cluster running on your laptop. The entire process, including installing Istio, Promethues, Kiali, Online Boutique, plus signing up for a Zebrium account and installing Zebrium log and metrics collectors, takes 20-30 minutes.
Important: Before starting, you will need to install minikube (instructions for Linux, MacOS and Windows here). You'll also need to install git, helm and curl (Google "curl" for your platform) if you don't already have them.
1. Sign-up for a Zebrium account
Now let's get going with your Zebrium account! You can sign-up for a new account here.

Once you've entered your details and set a password, you will see the Zebrium Setup page.
2. Because this is a demo environment, adjust some default Zebrium settings
The default settings of the Zebrium platform work well for most production environments. However, for the purpose of this demo, we will compensate for the short run time and small amount of data by changing a few default settings.
Set incident sensitivity to high and enable infrastructure incidents:
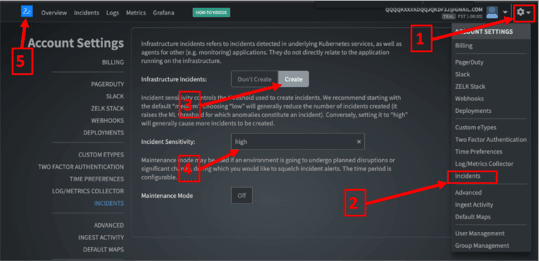
In the top RHS of the Setup page in Zebrium UI (see picture above), click the gear button (1) and select Incidents (2) from the dropdown. Now click "Create" (3) under Infrastructure Incidents (this will allow certain types of K8s infrastructure logs to be included for incident detection) and select "high" (4) under Incident Sensitivity.
Change the refractory period
When you break the demo app (see later), it will generate a lot of similar log events and patterns to ones that occurred during the bring-up of your demo environment. For this reason, we will change the default refractory period so that the ML will know it's ok to create an incident even if something similar has already happened recently.
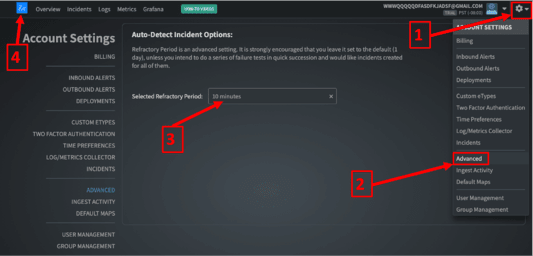
See picture above - in the top RHS, click the gear button (1) and select Advanced (2) from the dropdown. Set Refractory Period to 10 minutes (3). Finally click the Ze icon (4) in the top LHS to go back to the setup page.
It's important to note that the above settings are needed to compensate for the short run time and small amount of data in this demo setup. For normal use, you do not need to change these settings.
2. Start minikube with enough resources
Note the -p option for all minikube commands. This is because we will use a separate minikube instance named "boutique" (this will make it easier to clean-up when you're done).
minikube start --cpus=4 --memory 4096 --disk-size 32g -p boutique
In order to make the frontend IP address of the Online Boutique app accessible (needed later), you will need to run the "minikube tunnel command". It must be run in a separate terminal window.
# Make sure you run this command in a different window
minikube tunnel -p boutique
3. Install the Zebrium log and metrics collectors
Go the the Zebrium Setup page in your browser:
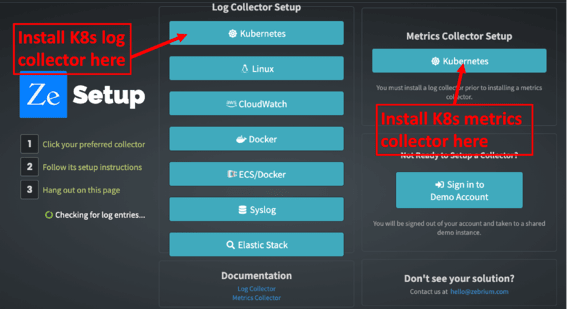
Start by clicking on "Kubernetes" under Log Collector Setup. This will produce a popup similar to the picture below. You should select to install with "Helm v3":

Now copy and paste the install commands from the Zebrium UI. When installing zlog-collector, set "zebrium.deployment" to a name like "boutique" and delete the part of the line that sets zebrium.timezone. See the example below (make sure you use the token from your own Zebrium UI):
# Install the Zebrium log collector by copying and pasting commands from the Zebrium UI.
kubectl create namespace zebrium
helm install zlog-collector zlog-collector --namespace zebrium --repo https://raw.githubusercontent.com/zebrium/ze-kubernetes-collector/master/charts --set zebrium.collectorUrl=https://zapi03.zebrium.com,zebrium.authToken=XXXXX,zebrium.deployment=boutique
Now install the Zebrium metrics collector by clicking on the from the Kubernetes button under "Metrics Collector Setup" in the Zebrium Setup UI. Once again use the Helm v3 method and cut and paste the commands from the UI popup. Note that when executing the install command for zstats-collector, use the same value that you used above ("boutique") for "zebrium.deployment":
# Install the Zebrium metrics collector by copying and pasting commands from the Zebrium UI.
helm repo add stable https://charts.helm.sh/stable
helm repo update
helm install node-exporter --namespace zebrium stable/prometheus-node-exporter
helm install zstats-collector zstats --namespace zebrium --repo https://raw.githubusercontent.com/zebrium/ze-stats/master/charts --set zebrium.collectorUrl=https://zapi03.zebrium.com/stats/api/v1/zstats,zebrium.authToken=XXXX,zebrium.deployment=boutique
The Zebrium ML will begin receiving and structuring logs and metrics from your newly created K8s environment.
4. Install Istio, Prometheus and Kiali
More detailed instructions for installing Istio service mesh can be found here. Istio and Prometheus aren't actually needed for the demo app, but it allows the use of Kiali which will give you a really nice graphical view of the environment!
First download Istio:
# Make a directory for this environment
mkdir onlineboutique
cd onlineboutique

# Get the latest version of Istio
curl -L https://istio.io/downloadIstio | sh -

# Check the name of the Istio directory that was created
ls

# go into Istio directory (name in ls output)
cd istio-1.8.0
Now install Istio and Prometheus:
#install istio. Note: if on a Mac and you get a message about istioctl being from an unidentified developer, see the note above.
kubectl create namespace istio-system
export PATH=$PWD/bin:$PATH
istioctl install --set profile=demo -y
kubectl label namespace default istio-injection=enabled

# Install Prometheus
kubectl apply -f ./samples/addons/prometheus.yaml
Now you're ready to Install and bring up kiali
# Make sure you are still in the Istio directory from the steps above
kubectl apply -f ./samples/addons/kiali.yaml
Important - you might see a bunch of errors saying something like: "unable to recognize...". If so, this is a known bug. To fix this, run the apply command again and you should see a few "...created" messages:
kubectl apply -f ./samples/addons/kiali.yaml
Verify that everything is running:
# Verify that Istio, Prometheus and Kiali pods are running. You should see something similar to below:
kubectl get pods -n istio-system
NAME                                    READY   STATUS    RESTARTS   AGE
istio-egressgateway-d84f95b69-zghjf     1/1     Running   0          20m
istio-ingressgateway-75f6d79f48-zcpk2   1/1     Running   0          20m
istiod-c9f6864c4-q68bj                  1/1     Running   0          21m
kiali-7476977cf9-jkz6b                  1/1     Running   0          15m
prometheus-7bfddb8dbf-8sg46             2/2     Running   0          19m
You can now bring up the Kiali UI. It will appear in a new tab in your browser.
# Bring up the Kiali UI (this will open the UI in a new browser tab)
istioctl dashboard kiali &
5. Time to install and fire up the Online Boutique app
The app has 12 services (adservice, cartservice, checkoutservice, currencyservice, emailservice, frontend, loadgenerator, paymentservice,productcatalogservice, recommendationservice, redis-cart and shippingservice) and will take a few minutes to start up. While starting up, you might see some of the pods enter Error/CrashLoopBackOff states a few times. Make sure you wait until they are all in a Running state.
# Go back to the directory you created above (onlineboutique)
cd ..

# Clone the Online Boutique repository
git clone https://github.com/GoogleCloudPlatform/microservices-demo.git
cd microservices-demo

# Install the app.
kubectl apply -f ./release/kubernetes-manifests.yaml

# Check to see if everything has started - this takes a few minutes. Keep checking and don't move on until all pods are in a running state
kubectl get pods
adservice-5f6f7c76f5-mnn2v               2/2     Running   0          4m18s
cartservice-675b6659c8-nzrnb             2/2     Running   2          4m19s
checkoutservice-85d4b74f95-jm4z8         2/2     Running   0          4m20s
currencyservice-6d7f8fc9fc-l74nc         2/2     Running   0          4m19s
emailservice-798f4f5575-b72s6            2/2     Running   0          4m20s
frontend-6b64dc9665-g22mp                2/2     Running   0          4m19s
loadgenerator-7747b67b5-8946m            2/2     Running   4          4m19s
paymentservice-98cb47fff-rxqjm           2/2     Running   0          4m19s
productcatalogservice-7f857c47f-kml88    2/2     Running   0          4m19s
recommendationservice-5bf5bcbbdf-9g5l2   2/2     Running   0          4m20s
redis-cart-74594bd569-vbx5h              2/2     Running   0          4m18s
shippingservice-75f7f9dc6c-sfczx         2/2     Running   0          4m18s
Once all the services are Running, you can bring up the app in your browser. You will need to get the frontend IP address by running the command below (make sure that you didn't forget the "minikube tunnel" command in step 1 above or this won't work).
#get IP address for boutique and then open EXTERNAL-IP in a browser tab (sample output below)
kubectl get service/frontend-external
NAME                TYPE           CLUSTER-IP     EXTERNAL-IP    PORT(S)        AGE
frontend-external   LoadBalancer   10.99.208.30   10.99.208.30   80:32326/TCP   6h8m
Now open the EXTERNAL-IP address in a new browser tab! And you should see the online boutique app:

In the Kiali tab in your browser, click Graph. In the Display dropdown, select "Traffic animation". You should see something like the picture below:

Important: Now go and get a cup of your favorite beverage and come back in 10 minutes. Yes I'm serious! This will give the Zebrium ML a chance to learn the structures and patterns that occur under normal running conditions.
6. Break the Online Boutique app
In the Kiali dashboard, you can see that a lot of traffic moves through the "productcatalogservice" (select Traffic Animation under the Display dropdown in the Kiali graph dashboard). So let's kill the productcatalogservice pod!
# Kill the productservicecatalog pod by scaling it to zero
kubectl scale deploy productcatalogservice --replicas=0; date
Note down the time from the output of the "date" command in the step above. Go to your browser and you should see that the app no longer works and the Kiali dashboard should show a lot of red:


7. The results
Since this is a brand new Zebrium instance, things can take a bit longer than usual and so it could take 10 minutes or more before Zebrium detects the problem. Also, since there are many new/rare patterns in the logs, and because incident sensitivity is set to high, you will likely get a bunch of new incidents even though not all of them are for real problems.
Also, you might notice that when the relevant incident is first created, it is incomplete (it might not be as detailed as the example below). Give it some time and you might see that the detail of the incident improves. This is because the machine learning will continue to refine its model over the next few hours.
When Zebrium does detect the incident, you will get a Slack alert (you should have a received an email to join the Zebriumcommunity Slack workspace). You can also click on the incidents tab in the Zebrium UI at any time to see a list of incidents that have been detected. This is what my environment looks like:

The incident with the red box is the one that that we induced. Here's how to understand the incident list (see picture above):
- 1 - shows time of the incident
- 2 - shows hosts and logs that the incident spans
- 3 - shows the First event in the incident. This often gives a clue of the root cause.
- 4 - shows the Worst event in the incident. This is usually the event that a human would think of as being the most serious event in the incident.
Now, to see details of what was detected, click on "INCIDENT REPORT" and you should see something like this:
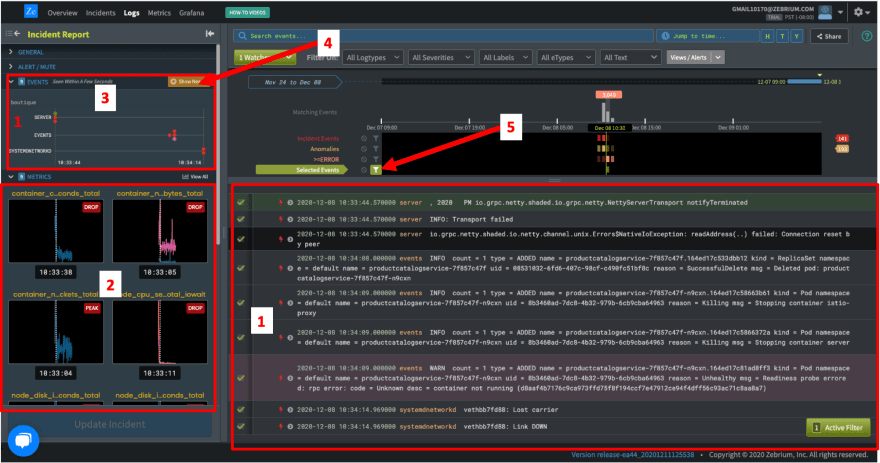
- 1 - shows the events that make up this incident. They tell the story of what happened. Note in particular this one which tells us the root cause "Deleted pod: productcatalogservice-7f857c47f-n9cxn":

- 2 - shows related metrics anomalies. You can see that everything suddenly drops at the same time the pod was deleted.
- 3 - shows a timeline of the incident. You can click on any of the dots to go to that particular event (this is very useful if you turn the filter off - see below)
- 4 - is the Show Nearby button. It will bring in additional anomalies and errors that our ML has detected nearby. This often helps to provide more detail on the incident.
- 5 - is the Filter button for the incident. Click the green filter button to turn off incident filtering. This will show you all the log events around your current position.
8. Optional clean-up of the minikube K8s instance
When you're done with testing the microservices app, you can delete the entire minikube K8s cluster with the following commands. Warning, you can't undo this step!
# Stop and delete the minikube K8s cluster - WARNING: you can't undo this!
minikube stop -p boutique
minikube delete -p boutique
Summary
The above steps provide an easy way to test Zebrium's machine learning technology - just fire up a demo app, break the app and then see how Zebrium detects the problem and its root cause. But don't get lost in the weeds! The most important thing to remember is that the problem was detected by our machine learning without any prior understanding of your environment, and with absolutely no human built rules.
The Zebrium ML technology works by learning the structures and patterns in your logs and metrics. It then finds incidents by looking for hotspot of abnormally correlated anomalous patterns across your logs and metrics. More detail about how it works can can be found here.
We encourage you to continue exploring the Zebrium platform with the demo environment you have built. But really the best way to see the magic of Zebrium is to try it with your real application - you'll be amazed at what it finds!

Top comments (0)