
What is Ceph?
Ceph is open source, software-defined storage maintained by RedHat. It’s capable of block, object, and file storage. The clusters of Ceph are designed in order to run on any hardware with the help of an algorithm called CRUSH (Controlled Replication Under Scalable Hashing). This algorithm ensures that all the data is properly distributed across the cluster and data quickly without any constraints. Replication, Thin provisioning, Snapshots are the key features of the Ceph storage.
Ceph object storage is accessible through Amazon Simple Storage Service (S3) and OpenStack Swift Representational State Transfer (REST)-based application programming interfaces (APIs), and a native API for integration with software applications.
Ceph block storage makes use of a Ceph Block Device, which is a virtual disk that can be attached to bare-metal Linux-based servers or virtual machines. The Ceph Reliable Autonomic Distributed Object Store (RADOS) provides block storage capabilities, such as snapshots and replication. The Ceph RADOS Block Device is integrated to work as a back end with OpenStack Block Storage.
What is Prometheus?
Prometheus is a free software application used for event monitoring and alerting.It records real-time metrics in a time series database (allowing for high dimensionality) built using a HTTP pull model, with flexible queries and real-time alerting.The project is written in Go and licensed under the Apache 2 License, with source code available on GitHub, and is a graduated project of the Cloud Native Computing Foundation, along with Kubernetes and Envoy.
Prometheus collects metrics from monitored targets by scraping metrics HTTP endpoints on these targets. Since Prometheus also exposes data in the same manner about itself, it can also scrape and monitor its own health.
What is Grafana?
Grafana is an open source solution for running data analytics, pulling up metrics that make sense of the massive amount of data & to monitor our apps with the help of cool customizable dashboards.
Grafana connects with every possible data source, commonly referred to as databases such as Graphite, Prometheus, Influx DB, ElasticSearch, MySQL, PostgreSQL etc.
Grafana being an open source solution also enables us to write plugins from scratch for integration with several different data sources.
The tool helps us study, analyse & monitor data over a period of time, technically called time series analytics.
Ceph Deployment
Deploying highly available Ceph cluster is pretty straightforward and easy. I am assuming that you are familiar with setting up the Ceph cluster. If not then refer the official document or following commands.
Configure Ceph repo:
sudo vim /etc/yum.repos.d/ceph.repo
[ceph]
name=Ceph packages for $basearch
baseurl=https://download.ceph.com/rpm-nautilus/el7/$basearch
enabled=1
priority=1
gpgcheck=1
gpgkey=https://download.ceph.com/keys/release.asc

[ceph-noarch]
name=Ceph noarch packages
baseurl=https://download.ceph.com/rpm-nautilus/el7/noarch
enabled=1
priority=1
gpgcheck=1
gpgkey=https://download.ceph.com/keys/release.asc

[ceph-source]
name=Ceph source packages
baseurl=https://download.ceph.com/rpm-nautilus/el7/SRPMS
enabled=0
priority=1
gpgcheck=1
gpgkey=https://download.ceph.com/keys/release.asc
Installing ceph-deploy
sudo yum install ceph-deploy -y
Create a directory
mkdir ceph-cluster
cd ceph-cluster
Create the cluster:
ceph-deploy new node1 node2 node3
Install Ceph packages:
ceph-deploy install node1 node2 node3
Deploy the initial monitors and gather the keys
ceph-deploy mon create-initial
Create admin
ceph-deploy admin node1 node2 node3
Create Mgr
ceph-deploy mgr create node1
Create Osds
ceph-deploy osd create --data /dev/xvdb node1
ceph-deploy osd create --data /dev/xvdb node2
ceph-deploy osd create --data /dev/xvdb node3
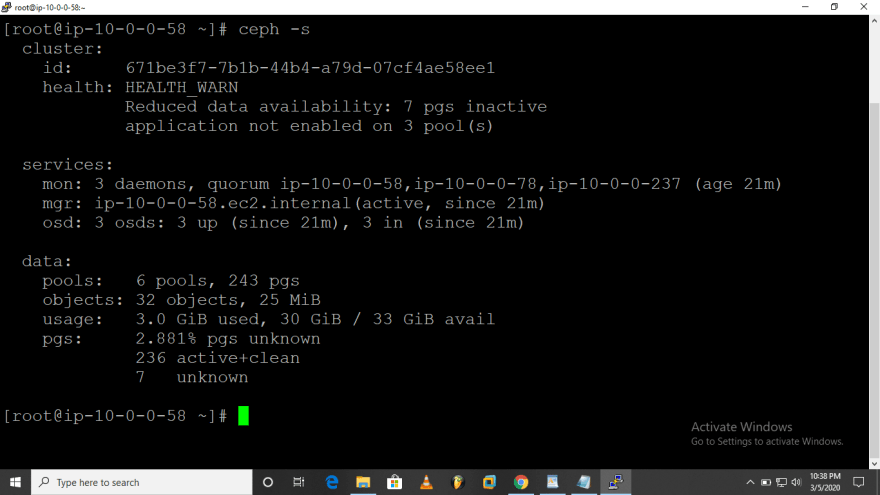
Check your cluster's status
sudo ceph -s
you should see something like:
Installing Prometheus
Run the following command to download and install Prometheus.
sudo wget https://github.com/prometheus/prometheus/releases/download/v2.8.1/prometheus-2.8.1.linux-amd64.tar.gz
Add a Prometheus user.
sudo useradd --no-create-home --shell /bin/false prometheus
Create needed directories.
sudo mkdir /etc/prometheus
sudo mkdir /var/lib/prometheus
Change the owner of the above directories.
sudo chown prometheus:prometheus /etc/prometheus
sudo chown prometheus:prometheus /var/lib/prometheus
Now go to Prometheus downloaded location and extract it.
sudo tar -xvzf prometheus-2.8.1.linux-amd64.tar.gz
Rename it as per your preference.
sudo mv prometheus-2.8.1.linux-amd64 prometheuspackage
Copy “prometheus” and “promtool” binary from the “prometheuspackage” folder to “/usr/local/bin”.
sudo cp prometheuspackage/prometheus /usr/local/bin/
sudo cp prometheuspackage/promtool /usr/local/bin/
Change the ownership to Prometheus user.
sudo chown prometheus:prometheus /usr/local/bin/prometheus
sudo chown prometheus:prometheus /usr/local/bin/promtool
Copy “consoles” and “console_libraries” directories from the “prometheuspackage” to “/etc/prometheus folder”
sudo cp -r prometheuspackage/consoles /etc/prometheus
sudo cp -r prometheuspackage/console_libraries /etc/prometheus
Change the ownership to Prometheus user
sudo chown -R prometheus:prometheus /etc/prometheus/consoles
sudo chown -R prometheus:prometheus /etc/prometheus/console_libraries
Now we will create the prometheus.yml file.
sudo vim /etc/prometheus/prometheus.yml
Add the following configuration to the file.
global:
  scrape_interval: 10s

scrape_configs:
  - job_name: 'prometheus_master'
    scrape_interval: 5s
    static_configs:
      - targets: ['localhost:9283']
---{copy the port no. which you get after firing command ceph mgr services}---
Change the ownership of the file.
sudo chown prometheus:prometheus /etc/prometheus/prometheus.yml
Configure the Prometheus Service File.
sudo vim /etc/systemd/system/prometheus.service
Copy the following content to the file.
[Unit]
Description=Prometheus
Wants=network-online.target
After=network-online.target

[Service]
User=prometheus
Group=prometheus
Type=simple
ExecStart=/usr/local/bin/prometheus \
--config.file /etc/prometheus/prometheus.yml \
--storage.tsdb.path /var/lib/prometheus/ \
--web.console.templates=/etc/prometheus/consoles \
--web.console.libraries=/etc/prometheus/console_libraries

[Install]
WantedBy=multi-user.target
Reload the systemd service.
sudo systemctl daemon-reload
Start the Prometheus service.
sudo systemctl start prometheus
Check service status.
systemctl status prometheus
Use the following Url to access UI.
http://Server-IP:9090/graph
Then you can see the following interface.

Installing grafana
Create a repo file.
vim /etc/yum.repos.d/grafana.repo
Add the following contents to file:
[grafana]
name=grafana
baseurl=https://packages.grafana.com/oss/rpm
repo_gpgcheck=1
enabled=1
gpgcheck=1
gpgkey=https://packages.grafana.com/gpg.key
sslverify=1
sslcacert=/etc/pki/tls/certs/ca-bundle.crt
sudo vim /etc/yum.repos.d/grafana.repo
Enter the following command:
sudo yum install grafana -y
Continue with following commands to install the free type and urw fonts.
sudo yum install fontconfig
sudo yum install freetype*
sudo yum install urw-fonts
Check the status of the service.
sudo systemctl status grafana-server
If service is not active, start it using the following command:
sudo systemctl start grafana-server
Enable Grafana service on system boot
sudo systemctl enable grafana-server.service
Use the following URL to access the Grafana web interface.
http://Your Server IP or Host Name:3000/
Then you can see the following interface.

Enabeling dashboard service on ceph cluster
Mgr enable dashboard
ceph mgr module enable dashboard --force
Mgr enable Prometheus
ceph mgr module enable prometheus --force
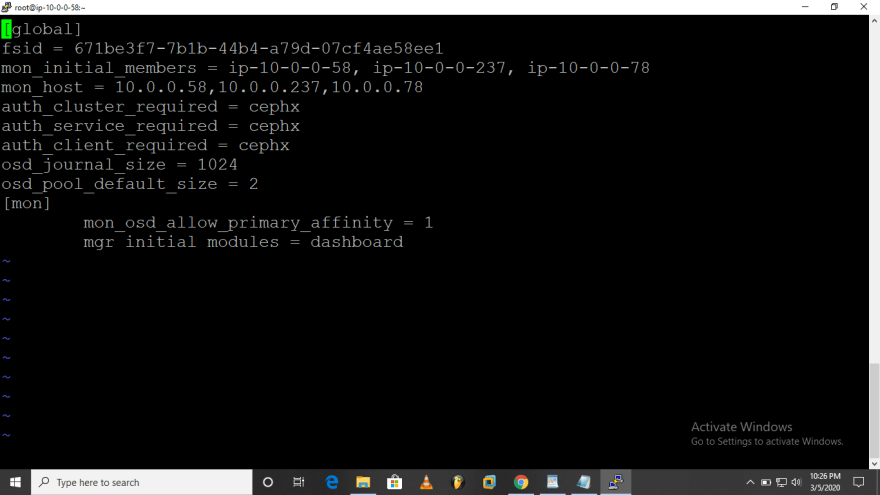
Edit the ceph.conf
vim ceph-deploy/ceph.conf
Add:
[mon]
        mgr initial modules = dashboard
Check Mgr Services:

---{update the file /etc/prometheus/prometheus.yml with the obtained port no. as target port no. }---
As you have successfully installed prometheus and grafana for ceph monitoring
Let us begin the grafana setup now
1. Login to grafana with default username and password as admin
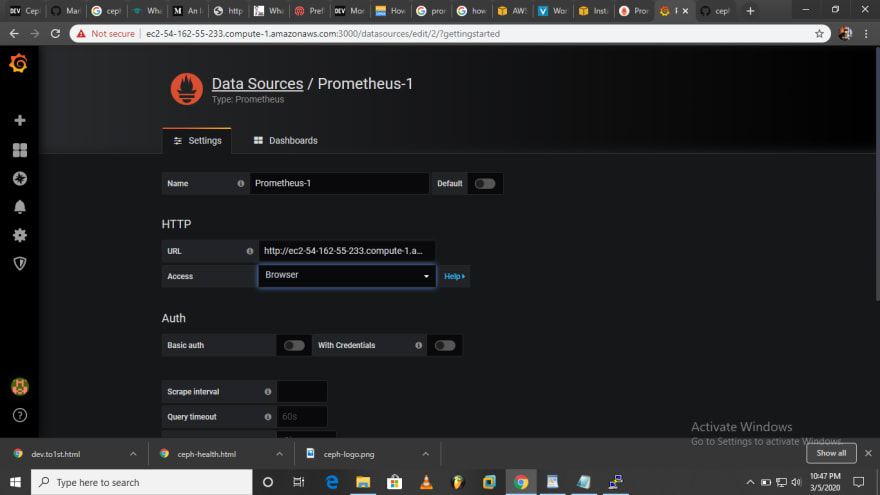
2. Click on to create a datasource
3. Select Prometheus

4. Enter url of prometheus
5. Click on Import and enter ceph-cluster grafana dashboard id "7056"
6. Choose Name and Ceph Prometheus data source

Finally we have successfully integrated our Ceph Cluster with Prometheus and Grafana!


Top comments (4)
Hi
very nice article.
but im not clear from the step 4
Enter prometheus URL, after that dashbaord id 7056. i dint understoof this step. can you please clear my doubts here
Hi @pdildako first of all I'm very sorry about late reply:(
.
.
prometheus url is the url which you get after running ceph mgr services.
dileep.2380@gmail.com or can you whatsapp me on 8106636056.
i have 15years work exp in IT Firm.
im using ceph + grafana+ prometheus