D3.js is perhaps the most popular framework for building data-driven visualizations in the web. It offers a wide variety of tools that give dynamic properties based on the data that we pass in. It's also a fully-featured framework for working with the DOM, allowing us to give these dynamic properties into tangible elements in the web page.
D3 got me really interested in building all kinds of interactive charts, so I decided to take the Fullstack D3 course to help me get going! The biggest takeaway I got from there is this 7-step process for building any dataviz component:
- Fetch/Access data
- Create chart dimensions (how big do we want our chart to be?)
- Draw the canvas (use the dimensions to define the inner/outer bounds of our chart)
- Create scales (transform data values into dynamic properties)
- Draw data
- Draw peripherals (like the X/Y axes, annotations/legends, etc.)
- Set up interactions (like showing tooltips on hover)
Let's create a simple Line Chart using D3 as an example. I'm using the same Line Chart example from the free chapter of the Fullstack D3 course. It doesn't include Step 7, but this example should be good enough to show our step-by-step process in action!
async function drawLineChart() {
  //* Step 1. Access Data
  const data = await d3.json("./data/my_weather_data.json");

  const dateParser = d3.timeParse("%Y-%m-%d");

  const xAccessor = (d) => dateParser(d["date"]);
  const yAccessor = (d) => d["temperatureMax"];

  //* Step 2. Create chart dimensions
  let dimensions = {
    width: window.innerWidth * 0.9,
    height: 400,
    margins: {
      top: 15,
      right: 15,
      bottom: 40,
      left: 60,
    },
  };

  dimensions.boundedWidth =
    dimensions.width - dimensions.margins.left - dimensions.margins.right;
  dimensions.boundedHeight =
    dimensions.height - dimensions.margins.top - dimensions.margins.bottom;

  //* Step 3. Draw canvas
  const wrapper = d3
    .select("#wrapper")
    .append("svg")
    .attr("width", dimensions.width)
    .attr("height", dimensions.height);

  const bounds = wrapper
    .append("g")
    .style(
      "transform",
      `translate(${dimensions.margins.left}px, ${dimensions.margins.top}px)`
    );

  //* Step 4. Create scales
  const yScale = d3
    .scaleLinear()
    .domain(d3.extent(data, yAccessor))
    .range([dimensions.boundedHeight, 0]);

  const xScale = d3
    .scaleTime()
    .domain(d3.extent(data, xAccessor))
    .range([0, dimensions.boundedWidth]);

  const freezingTemperaturePlacement = yScale(32);
  const freezingTemperatures = bounds
    .append("rect")
    .attr("x", 0)
    .attr("width", dimensions.boundedWidth)
    .attr("y", freezingTemperaturePlacement)
    .attr("height", dimensions.boundedHeight - freezingTemperaturePlacement)
    .attr("fill", "hsl(180deg 44% 92%)"); // "#e0f3f3"

  //* Step 5. Draw data
  const lineGenerator = d3
    .line()
    .x((d) => xScale(xAccessor(d)))
    .y((d) => yScale(yAccessor(d)));

  const line = bounds
    .append("path")
    .attr("d", lineGenerator(data))
    .attr("fill", "none")
    .attr("stroke", "hsl(41deg 35% 52%)") // "#af9358"
    .attr("stroke-width", 2);

  //* Step 6. Draw peripherals
  const yAxisGenerator = d3.axisLeft().scale(yScale);

  const yAxis = bounds.append("g").call(yAxisGenerator);

  const xAxisGenerator = d3.axisBottom().scale(xScale);
  const xAxis = bounds
    .append("g")
    .style("transform", `translateY(${dimensions.boundedHeight}px)`)
    .call(xAxisGenerator);
}

drawLineChart();
In less than 90 lines of code, we can display this basic line chart:
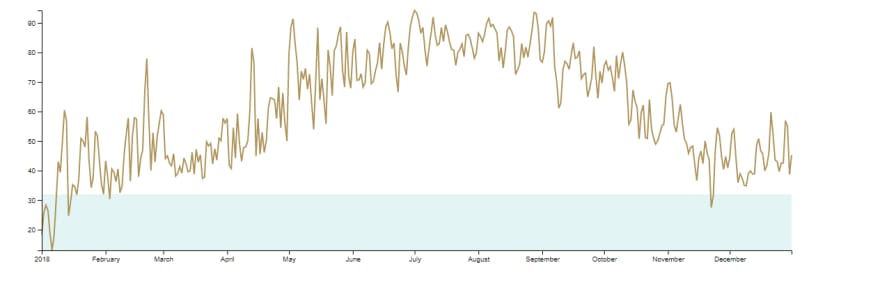
For vanilla JS projects this code is usually good enough, but I wanted to go a step further. I wanted to integrate D3 code into my existing React projects, so I took some time rewriting the course exercises and projects from vanilla D3 into D3 + React (+ TypeScript, for extra challenge).
What is Headless UI?
The Headless UI pattern (not to be confused with the Tailwind Labs project with the same name) is a pattern in which the logical parts (i.e. the state, dynamic properties, lifecycle methods, etc.) of components are separated from the rendering logic (i.e. the HTML markup and the CSS styles).
I recently watched an excellent talk in React Summit about using the Headless UI pattern in a well-known open-source library, and I realized "Huh, Isn't this pretty much what I've been doing with my D3+React rewrite project?"
And indeed, when I rewrite my D3 charts into React I can see a clear separation between the logical parts of my chart and the markup I render into the page. This makes sense, because I'm still using the same tools D3 gives me, but I swapped the D3 selectors and data joins out and let React handle the rendering instead.
Using D3 for Headless Data Visualizations
As it turns out, our step-by-step process gives us a clear opportunity to separate the logical parts of our chart from the markup and styles!
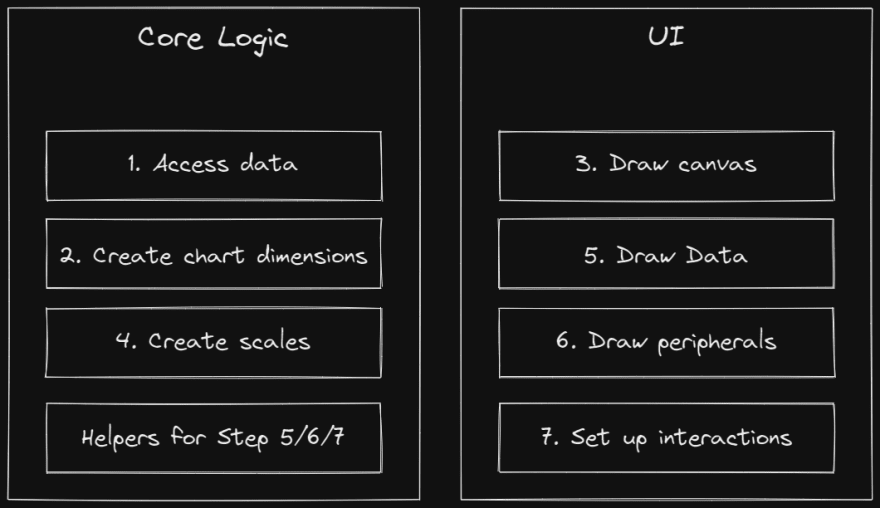
In my React rewrite of that Line Chart example from earlier, the logical parts of the chart only consists of steps 1, 2, and 4, as well as some helpers for steps 5 and 6. Notice how we're still using the same D3 methods to get the scales and generator functions for our data:
function LineChart({ dataset }: { dataset: WeatherData[] }) {
  //* Step 1b. Access Data
  const dateParser = d3.timeParse("%Y-%m-%d");
  const xAccessor = (d: WeatherData) => dateParser(d.date) as Date;
  const yAccessor = (d: WeatherData) => d.temperatureMax;

  //* Step 2. Create chart dimensions
  const dimensions: BoundedDimensions = {
    width: window.innerWidth * 0.9,
    height: 400,
    margin: {
      top: 15,
      right: 15,
      bottom: 40,
      left: 60,
    },
    //? Initialize the bounded dimensions here, so TypeScript doesn't get all fussy
    boundedWidth: 0,
    boundedHeight: 0,
  };

  dimensions.boundedWidth =
    dimensions.width - dimensions.margin.left - dimensions.margin.right;
  dimensions.boundedHeight =
    dimensions.height - dimensions.margin.top - dimensions.margin.bottom;

  //* Step 4. Create scales
  const xScale = d3
    .scaleTime()
    .domain(d3.extent(dataset, xAccessor) as [Date, Date])
    .range([0, dimensions.boundedWidth]);

  const yScale = d3
    .scaleLinear()
    .domain(d3.extent(dataset, yAccessor) as [number, number])
    .range([dimensions.boundedHeight, 0]);

  const freezingTemperaturePlacement = yScale(32);

  //* Set up steps 5 and 6
  const lineGenerator = d3
    .line<WeatherData>()
    .x((d) => xScale(xAccessor(d)))
    .y((d) => yScale(yAccessor(d)));

  const xTicks = xScale.ticks();
  const yTicks = yScale.ticks();

  //* The rest is the rendering logic
}
The rendering logic for step 6 actually gets a bit tricky, since we used some built-in D3 methods to put our X/Y axes directly into the DOM. Fortunately, D3 also gives us some handy tools to build our own X/Y axes from scratch, with a bit of peeking at the final rendered output to check the markup we need to copy.
Here's what our markup now looks like:
function LineChart({ dataset }: { dataset: WeatherData[] }) {
  //* Steps 1, 2, and 4 omitted for brevity

  return (
    <div>
      {/* Step 3. Draw canvas */}
      <svg width={dimensions.width} height={dimensions.height}>
        <g
          transform={`translate(${dimensions.margin.left}, ${dimensions.margin.top})`}
        >
          <rect
            x="0"
            width={dimensions.boundedWidth}
            y={freezingTemperaturePlacement}
            height={dimensions.boundedHeight - freezingTemperaturePlacement}
            fill="hsl(180deg 44% 92%)"
          />
          {/* Step 5. Draw data */}
          <path
            d={lineGenerator(dataset) ?? ""}
            fill="none"
            stroke="hsl(41deg 35% 52%)"
            strokeWidth={2}
          />
          {/* Step 6. Draw peripherals */}
          <g
            fontSize={10}
            fontFamily="sans-serif"
            textAnchor="middle"
            transform={`translate(0, ${dimensions.boundedHeight})`}
          >
            <line stroke="black" x2={dimensions.boundedWidth} />
            {xTicks.map((tick, i) => (
              <g key={i} transform={`translate(${xScale(tick)}, 0)`}>
                <line stroke="black" y2={6} />
                <text y={9} dy="0.71em">
                  {d3.timeFormat("%B")(tick)}
                </text>
              </g>
            ))}
          </g>
          <g fontSize={10} fontFamily="sans-serif" textAnchor="end">
            <line stroke="black" y2={dimensions.boundedHeight} />
            {yTicks.map((tick, i) => (
              <g key={i} transform={`translate(0, ${yScale(tick)})`}>
                <line stroke="black" x2={-6} />
                <text x={-9} dy="0.32em">
                  {tick}
                </text>
              </g>
            ))}
          </g>
        </g>
      </svg>
    </div>
  );
}

It doesn't look exactly the same, but I think it's pretty indistinguishable from our original example unless you squint hard enough!
The full code for the Line Chart rewritten in React results in slightly longer code, adding up to a little over 100 lines. I'd say that's good enough, given that we had to create our X/Y axes from scratch!
What's more, we can actually make our Line Chart a bit more reusable. We can skip Step 2 by accepting the chart dimensions as a prop instead, and we can also make a different Line Chart for other metrics my passing the metric we want as a prop as well (as long as that metric returns a numeric value, of course 😉)!
function LineChart({
  dataset,
  dimensions,
  metric,
}: {
  dataset: WeatherData[];
  dimensions: BoundedDimensions;
  metric: NumericWeatherDataMetric;
}) {
  //* Step 1b. Access Data
  const dateParser = d3.timeParse("%Y-%m-%d");
  const xAccessor = (d: WeatherData) => dateParser(d.date) as Date;
  const yAccessor = (d: WeatherData) => d[metric];

  //* We can skip Step 2 here because we're now accepting the dimensions as a prop.

  // Literally everything else stays the same!
}
Going further
Another awesome part of that React Summit talk was taking the Headless UI pattern one step further and going Framework Agnostic, essentially having the same functionality no matter which framework you use. Let's apply the same concept with our Line Chart!
Adding code snippets for the same component written in different frameworks feels redundant, so I'll just provide links instead:
Here's a quick tl;dr:
- Separating the logical parts of our chart from the markup and styles pretty much did most of the heavy lifting for making our chart framework agnostic! The main difference across my rewrites had to do with the framework-specific ways to render the markup, and passing the dynamic properties to the relevant elements.
- Having the same logic reused across different frameworks let me do these rewrites a lot faster than I expected! I had basically zero knowledge on how to write Vue/Svelte/Solid components before I did these rewrites, but since I already know what goes into the Line Chart, all it took to rewrite it in these different frameworks was a couple minutes of browsing thru their respective docs about a few basic topics on their rendering logic:
- Fetching data
- Passing props to components
- Using dynamic properties in the markup
- Rendering lists
I see a lot of potential with this Headless UI pattern paired with D3. For instance we can extract some of these commonly used D3 methods and generator functions into a custom React hook (or whatever their equivalents are in other frameworks), and make a reusable headless library of common charts powered by D3!
Rewriting my previous D3 exercises and projects into React provided an even more awesome learning experience beyond the course material, and thanks to that one React Summit talk I also gained some new insights about reusable code patterns and even applied my knowledge in different frameworks!

Top comments (1)
I recently saw something similar, but maybe with a "next step" in there.
The example used react and custom hooks to hold the logic/state and have a humble object for rendering the markdown.
You can always split what's logic from state and then have one that knows about the framework and another that is just JS/TS (and in this case, D3).
This way you have more files, but in your case, you would have a "doD3Stuff" function that you would simply import/copy paste in each project and then the framework parts of state and markdown.