DEV Community

Cover image for Redis as a Database — Speed Test with K6
Marius Muntean
Marius Muntean

Posted on

4

Redis as a Database — Speed Test with K6

In my previous post on using Redis as a Database I mentioned how I’m using it to store and retrieve tweets in the context of Visualizer, my pet project.

Now I want to show some performance characteristics of Visualizer.

Test Setup

The tests were performed on my M1 Pro Macbook Pro with 32 GB of ram, connected to WiFi and on battery power. I’m running both Visualizer microservices in Release mode with Jetbrains Rider, Redis Stack in the command line, Visualizer Frontend in VSCode and the current version of macOS Ventura.

Data Ingestion

Here’s the code to store a single tweet in Redis

var internalId = await _tweetCollection.InsertAsync(tweetModel);

This runs in a dedicated microservice and is executed every time a new tweet is retrieved from Twitter’s sample stream. In a future post I’ll present the architecture of Visualizer.

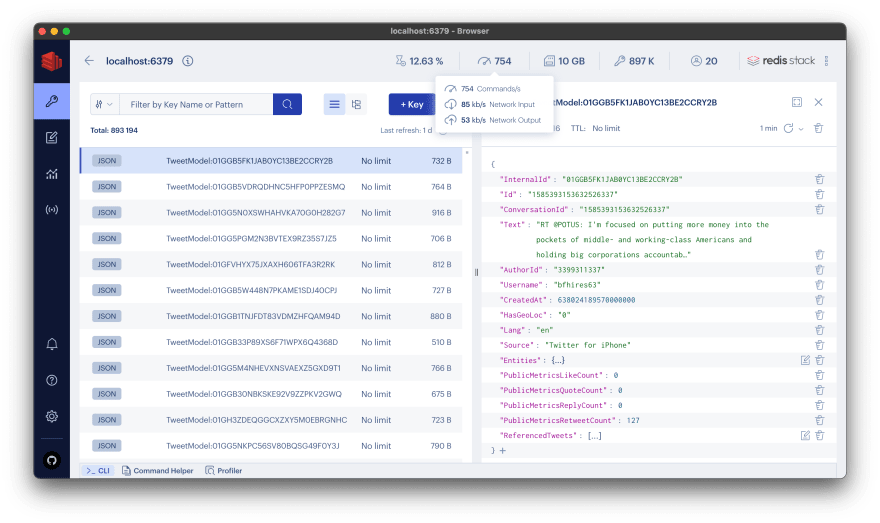
Using RedisInsight I can see that with my current setup I can manage to send around 700 commands per second, mostly storing tweets.

Data Retrieval

Retrieving data is handled by another microservice, which only reads from Redis.

Using K6 I wrote a script that retrieves 10 tweets from the GraphQL API

import http from "k6/http";
import { check } from "k6";
import { Counter } from "k6/metrics";
import { htmlReport } from "https://raw.githubusercontent.com/benc-uk/k6-reporter/main/dist/bundle.js";
import { textSummary } from "https://jslib.k6.io/k6-summary/0.0.1/index.js";
export const requests = new Counter("http_reqs");
export const options = {
stages: [
{ target: 60, duration: "5s" },
{ target: 30, duration: "1s" },
{ target: 10, duration: "1s" },
{ target: 0, duration: "2s" },
],
};
const query = `
query getFilteredTweets($filter: FindTweetsInputTypeQl!) {
tweet {
find(filter: $filter) {
total
tweets {
id
authorId
username
conversationId
lang
source
text
createdAt
geoLoc {
latitude
longitude
}
entities {
hashtags
mentions
}
publicMetricsLikeCount
publicMetricsRetweetCount
publicMetricsReplyCount
}
}
}
}
`;
const variables = { filter: { pageSize: 10, pageNumber: 1 } };
let headers = { "Content-Type": "application/json" };
export default function () {
const res = http.post(
"https://localhost:7083/graphql",
JSON.stringify({ query: query, variables: variables }),
{ headers: headers }
);
const checkRes = check(res, {
"status is 200": (r) => r.status === 200,
});
}
// This will export to HTML as filename "result.html" AND also stdout using the text summary
// Making use of the handleSummary callback to export to HTML with K6-REPORTER https://github.com/benc-uk/k6-reporter
export function handleSummary(data) {
return {
"result.html": htmlReport(data),
stdout: textSummary(data, { indent: " ", enableColors: true }),
};
}

The results are … a bit disappointing

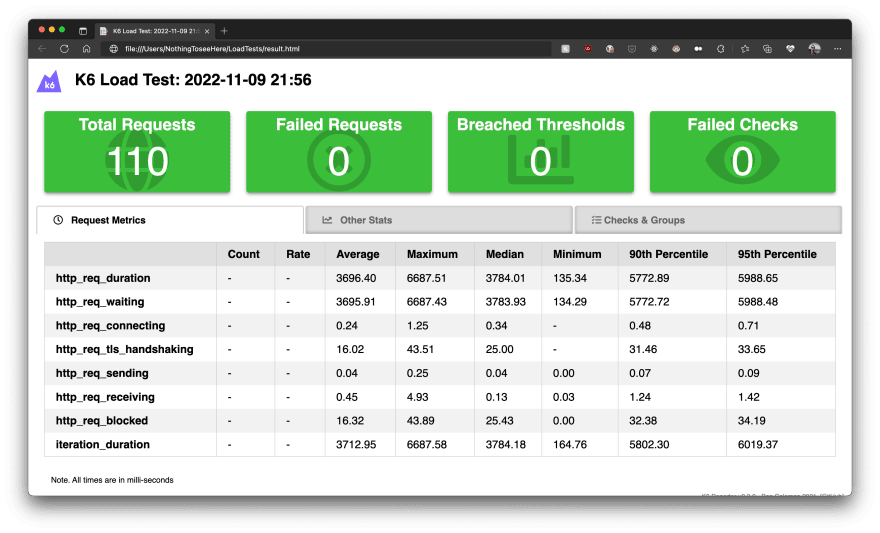
The average duration of 110 requests, over a period of 6 seconds, is ~3.7 seconds. I definitely need to investigate that. My suspicion is that I’m a bit inefficient with the deserialisation and that the GraphQL API has an inherent overhead.

Fortunately K6 has native support for Redis 😎 so I wrote another K6 script that basically does the same thing that the Visualizer microservice does behind the scenes, i.e. formulate and send a command to Redis to retrieve data from a certain index, sorted and paginated. But this time there’s no deserialization and GraphQL overhead

import redis from "k6/experimental/redis";
import { htmlReport } from "https://raw.githubusercontent.com/benc-uk/k6-reporter/main/dist/bundle.js";
import { textSummary } from "https://jslib.k6.io/k6-summary/0.0.1/index.js";
import { Trend } from "k6/metrics";
const RedisLatencyMetric = new Trend("redis_latency", true);
export const options = {
stages: [
{ target: 60, duration: "5s" },
{ target: 30, duration: "1s" },
{ target: 10, duration: "1s" },
{ target: 0, duration: "2s" },
],
};
// More details here https://k6.io/docs/javascript-api/k6-experimental/redis/client/
const redisClient = new redis.Client({
addrs: new Array("localhost:6379"),
password: "",
});
export default function () {
const start = Date.now();
redisClient.sendCommand(
"FT.SEARCH",
"tweetmodel-idx",
"(@HasGeoLoc:{1})",
"LIMIT",
"0",
"10",
"SORTBY",
"Username",
"ASC"
);
const latency = Date.now() - start;
RedisLatencyMetric.add(latency);
}
export function handleSummary(data) {
return {
"redis-result.html": htmlReport(data),
stdout: textSummary(data, { indent: " ", enableColors: true }),
};
}

And the results are much better

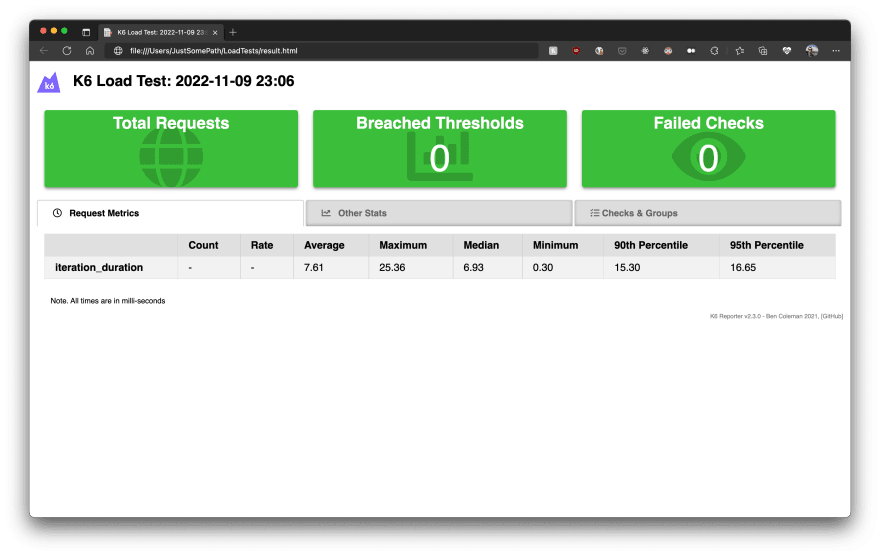
FYI, the Iteration_duration includes setup+request+teardown. This time around the average request duration was around 7.6 milliseconds.

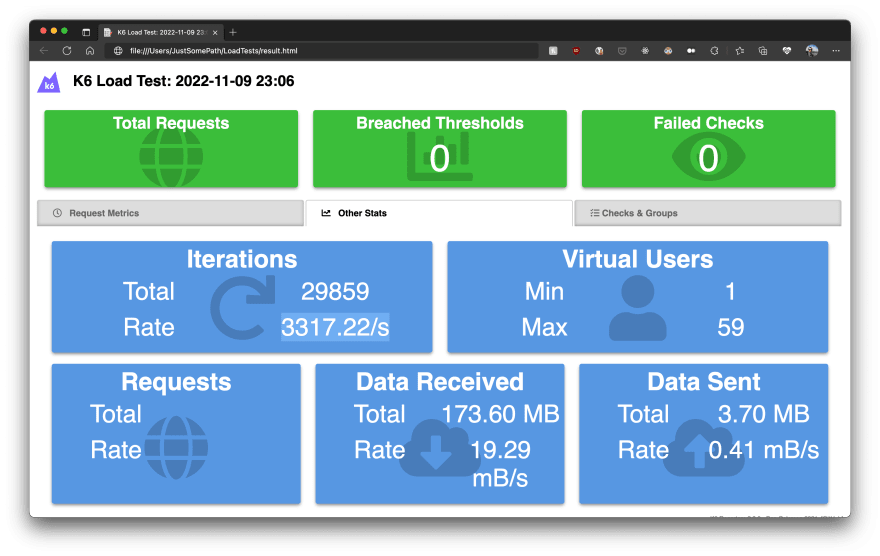
With up to 60 concurrent virtual users (a K6 term) Redis managed to serve over 29000 requests in 9 seconds, which works out to be around 3300 requests per second.

Conclusion

The system performed excellently on my battery-powered Macbook Pro, managing to store hundreads of tweets per second.

The read performance through my Visualizer microservice is disappointing and I definitely need investigate this further. Fortunately the problem doesn’t seem to be with Redis, which means I have a change to improve it.

Stay tuned for more updates from my journey in Redisland.

If you liked this post let me know on Twitter 😉 (@MunteanMarius), give it a ❤️ and follow me to get more content on Redis, Azure, MAUI and other cool stuff.

Image of Datadog

Create and maintain end-to-end frontend tests

Learn best practices on creating frontend tests, testing on-premise apps, integrating tests into your CI/CD pipeline, and using Datadog’s testing tunnel.

Download The Guide

Top comments (0)

Sentry image

See why 4M developers consider Sentry, “not bad.”

Fixing code doesn’t have to be the worst part of your day. Learn how Sentry can help.

Learn more