
As a web developer, one will often spend a lot of time using developer tools provided in the browser to inspect the DOM, do some style tweaking, debugging the code, and various other tasks.
I've been using Chrome for debugging for a long time. If you've noticed after updating the Chrome, when you open the dev tools then it may have What's new section giving us a summary and link to the full article. So, once I opened the link and found that there are many features that I've never used. And for some of them, I was using workarounds 😅. So, I thought let's do some reading and found many useful things from their docs. I'll be sharing a few of them here.
Accessing DOM element from Console
Select any element from the DOM tree available under the Elements tab. You'll see a == $0 being displayed at the end of your selection. It means that you can directly refer to that element from your Console. No need to make a querySelector call for that.
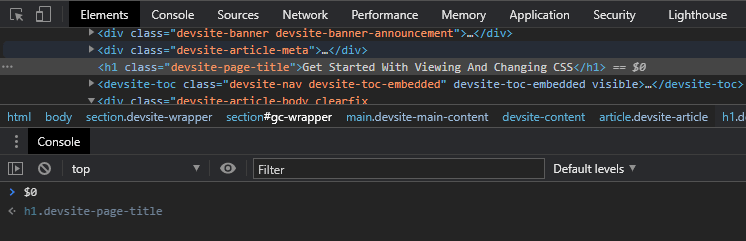
Also, Chrome keeps track of the last five selected elements. So, you can access them using $0 to $4.
Add/remove classes of an element
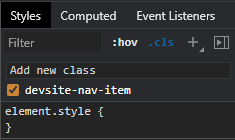
We often want to add or remove classes for an element to see how it affects before making those changes in the code. Under Elements > Styles tab there's a .cls button. On click, it'll open a list of classes with checkboxes to quickly add and remove it. A new class can be added from the provided input too.
Preserve log and Log XHR (Console settings)
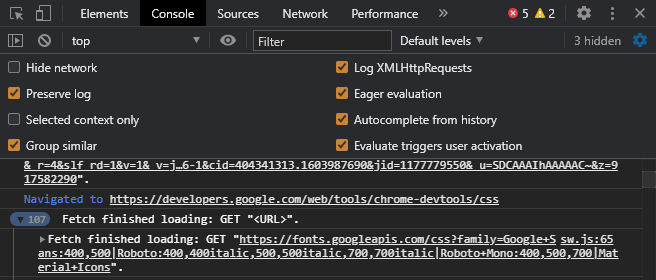
The debugging and other related logs are cleared on page reloads. It may be required across page reloads for comparison. Log preserving can be enabled from Console settings. It can be accessed from the top right corner of the Console tab.
Similarly, XHR logging can be enabled from there. It is helpful when a stack trace is needed for XHR calls.
Watch expressions
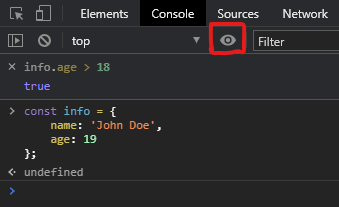
While debugging it may be required to keep an eye on the value changes for some variables. You can add watch expressions in the Console tab by clicking on an eye icon.
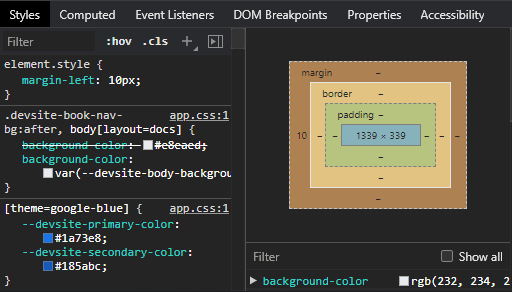
Change element sizing
To apply some padding or margin changes to the element, we can write them under the element.style block. But there's a quicker way. Just double-click on any of the values displayed in the CSS box model and change the value. It'll add the appropriate style property for sizing.
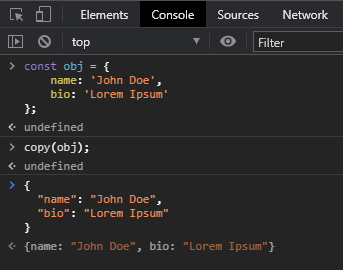
Copy object in JSON format
If you want to take note of object values or share it with someone then a long way to do that will be to call JSON.stringify and then copy that manually. Dev tools console exposes copy function to do just the same. Call copy with the object as an argument. It'll copy the JSON format of the provided object to the clipboard.
Come to the Dark side
You might've noticed my dev tools in Dark theme, if you don't know that you can do the same. Open the settings from the top right corner of the dev tools window. Select Dark under Preferences > Appearance > Theme.
Well, these are some of the basic features that I come across. To know more about what you can do with dev tools, do visit full docs.

Top comments (2)
Thank you @mohz for this article, these features are really useful for the development still remains unnoticed.
Indeed, @maulik .