In this Blog, we will be able to deploy our application in an EKS cluster and monitor it with Prometheus
In the previous blog, we set up a Prometheus Operator to help us monitor our applications. Now, we’ll deploy our application and use Prometheus to monitor it.
The prerequisites you need to archive this goal are:
You should be having an EKS cluster running
Your application yaml files
Before we deploy the application let's talk about the ground things such as ServiceMonitor
ServiceMonitor
ServiceMonitor is a Kubernetes object that specifies how Prometheus should monitor a set of targets that belong to a Kubernetes service.
For example, suppose we have a Kubernetes service called “myapp” that has several replicas running across different pods. We want to monitor these replicas using Prometheus. To do this, we can create a ServiceMonitor object in Kubernetes that specifies the labels and endpoints for the pods running the “myapp” service.
Here’s an example ServiceMonitor YAML file:
apiVersion: monitoring.coreos.com/v1
kind: ServiceMonitor
metadata:
  name: myapp-monitor
  namespace: mynamespace
  labels:
    app: myapp
spec:
  selector:
    matchLabels:
      app: myapp
  endpoints:
  - port: web
    interval: 30s
    path: /metrics
In this example, we define a ServiceMonitor called “myapp-monitor” in the “mynamespace” namespace. We specify that we want to monitor the pods that have the label “app=myapp”. We also specify that we want to scrape the “web” port on these pods every 30 seconds and that the metrics can be found at the “/metrics” endpoint.
Once we apply this ServiceMonitor YAML file to Kubernetes, Prometheus will automatically discover and monitor the targets that belong to the “myapp” service based on the label selector defined in the ServiceMonitor.
Overall, ServiceMonitors provide an easy way to configure Prometheus to scrape metrics from multiple pods that belong to a single Kubernetes service, allowing for more efficient and scalable monitoring of Kubernetes-based applications.
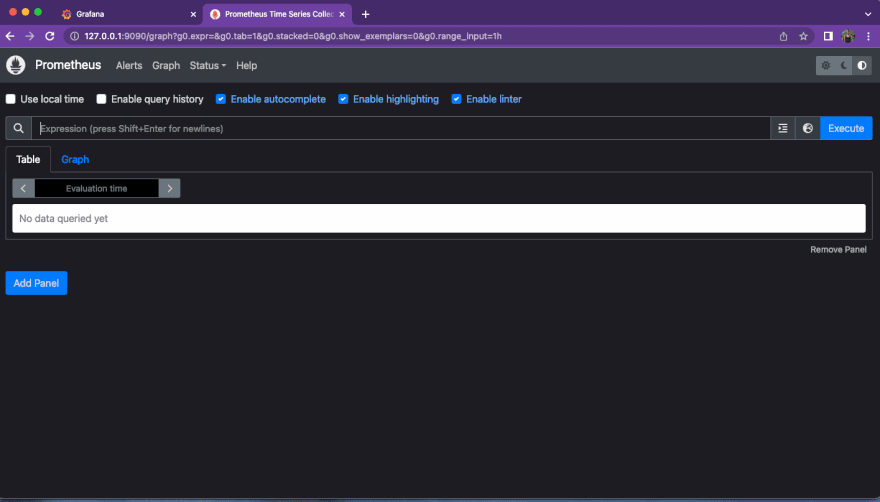
Since we have already configured PrometheusOperator in the cluster and we already viewed the Grafana Dashboard let us now view the Prometheus dashboard and see all the metrics being scraped by Prometheus
Prometheus Dashboard
To display Prometheus Dashboard we need to pass the port-forward attribute to the Prometheus service.
First, get the service name and the port running
Then expose the port outside using port-forward
kubectl port-forward svc/prometheus-operated 9090 -n monitor
The IP address is displayed go check out Prometheus
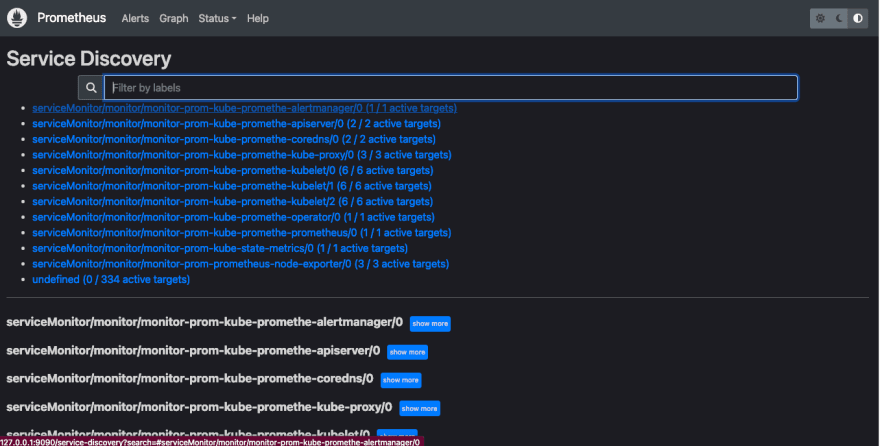
From the dashboard, we can check on the service discovery that Prometheus has discovered.
You can also check on the targets that Prometheus is scraping with the /metrics endpoint.
In our demo, we will deploy a microservice architecture and crape the metrics using Prometheus. But one more thing before we deploy our application it is important to know what Exporters are.
Exporters
What are exporters in Prometheus?
Exporters are software components that expose metrics in a format that can be understood by Prometheus. They act as intermediaries between Prometheus and the systems and applications that are being monitored, and they provide a standard way to collect metrics from a wide variety of sources.
Node-Exporter they are translator between application metrics to data that Prometheus will understand. An exporter itself will expose /metrics endpoint so that Prometheus can be able to scrape from there. They collect metrics data from applications and they can be a separate deployment in the cluster.
In the context of Kubernetes, exporters are typically deployed as sidecar containers in the same pod as the application or system component they are monitoring. The exporter is responsible for collecting metrics from the system or application and exposing them over HTTP or some other protocol, so that Prometheus can scrape them.
There are many different exporters available for Prometheus, covering a wide range of systems and applications. Some of the most common exporters include the Node Exporter (for collecting metrics from Linux servers), the Prometheus MySQL Exporter (for monitoring MySQL databases), and the Prometheus Blackbox Exporter (for monitoring network services).
How to use exporters in Kubernetes with Prometheus?
To use exporters in Kubernetes with Prometheus, you will typically follow these steps:
Identify the metrics you want to monitor, you will need to identify the metrics you want to monitor from your systems and applications. This will depend on the specific use case and the systems being monitored.
Install the appropriate exporter: Once you have identified the metrics you want to monitor, you will need to install the appropriate exporter for each system or application. This can be done using either the Helm chart or YAML manifests.
Configure Prometheus to scrape the exporter: Finally, you will need to configure Prometheus to scrape the metrics from the exporter. This is typically done by adding a scrape configuration to the prometheus.yaml file, specifying the URL of the exporter endpoint.
For example, if you want to monitor the CPU usage and memory usage of a Kubernetes pod, you can deploy the Node Exporter as a sidecar container in the same pod, and configure Prometheus to scrape the metrics from the Node Exporter’s endpoint. Once this is done, Prometheus will start collecting the metrics and storing them in its time series database, where they can be analyzed and visualized using Prometheus’s query language and dashboarding tools.
Why are exporters useful in Prometheus?
Exporters are useful in Prometheus for several reasons:
Support for diverse systems and applications: Exporters provide a standard way to collect metrics from a wide variety of systems and applications, making it easy to monitor different components of a Kubernetes environment.
Easy deployment and configuration: Exporters can be deployed as sidecar containers in Kubernetes pods, making it easy to configure and manage them alongside the systems and applications they are monitoring.
Consistent metric format: Exporters expose metrics in a consistent format that can be understood by Prometheus, making it easy to write queries and build dashboards that work across different systems and applications.
High performance: Exporters are typically designed to be highly performant and lightweight, so that they can collect metrics with minimal overhead and without impacting the performance of the systems they are monitoring.
In summary, exporters are a powerful and flexible feature of Prometheus that make it easy to monitor diverse systems and applications in Kubernetes environments. By using exporters, you can collect detailed metrics on the health and performance of your systems, and use this data to optimize and troubleshoot
Hands-on Demo
In the previous demo, we deployed Prometheus in our cluster we also exposed the ports for Grafana and Prometheus. Next let's install the application for this demo we will clone a git repository for a microservices application developed by google.
git clone https://github.com/GoogleCloudPlatform/microservices-demo
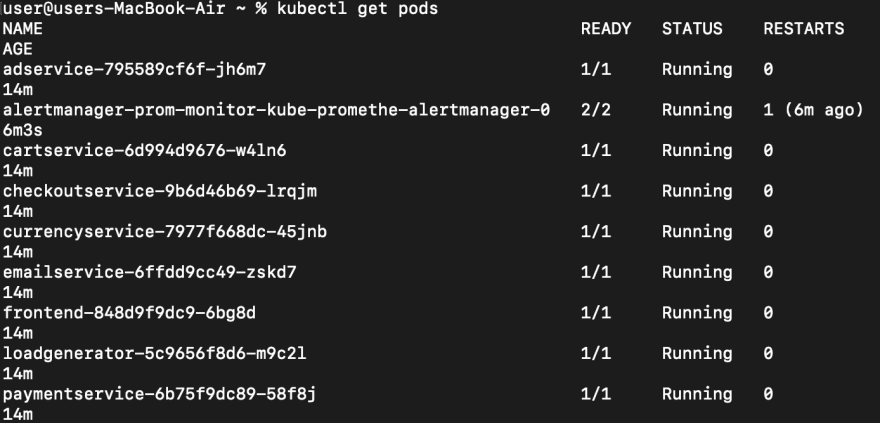
After installing the application we can view different components of the application
We can also view the application by port-forward, or using ingress or load balancers.
Next, we will install the exporter, and let's start with the Redis exporter. Open the Prometheus exporter page, we can search and find the Redis exporter. Exporters are also available as docker images and you can find them in the Docker Hub.
Components you need to have when deploying an exporter
-
The application itself in the docker image that exposes the /metrics endpoints
- A service so that Prometheus can connect to the exporter
- Service monitor to tell Prometheus that a new service has been created and it should start scraping it.
To install the Redis exporter in the most simplified way to use it we can search for a helm chart that is ready and configured to install the exporter.
helm repo add prometheus-community https://prometheus-community.github.io/helm-charts
The above command basically installs the Prometheus helm charts although we had already installed the chart when installing Prometheus. Next, let's install the node exporter chart.
But before we deploy the exporter there are some values that we need to change from the chart. Let's create values.yaml configuration that we will use to pass while using helm to install the radis node exporter
redisAddress: redis://redis-cart:6379
#the service we will monitor and the port

serviceMonitor:
  additionalLabels:
    release: prometheus
Save the file before running the helm install command giving your node exporter the name and passing the -f values.yaml file.
helm install redis-exporter prometheus-community/prometheus-redis-exporter -f values.yaml
You can then check the service monitor running in the cluster to see if we installed the Service monitor correctly.
Tomorrow we will finish from there: checking on the service discovery function and if Prometheus discovered our service monitor.


Top comments (0)