

In this blog we will be able to deploy prometheous operator in our EKS cluster and be able to view different dashboards like the grafana and the prometheus
Preriqities
- EKS cluster running
What is Prometheus Operator
Let's first define what Prometheus Operator is. It is an open-source project that simplifies the deployment and management of Prometheus and related monitoring components on Kubernetes.
It simplifies the deployment and management of Prometheus-based monitoring by automating tasks such as setting up monitoring targets, configuring alerting rules, and scaling the Prometheus servers.
Prometheus Operator is widely used in Kubernetes clusters to monitor applications and infrastructure. It is particularly useful for microservices-based architectures where applications are deployed as Kubernetes services or deployments.
Simply put: the core benefit of Prometheus Operator is simple and scalable deployment of a full Prometheus monitoring stack.
Traditionally, without Prometheus Operator customization and configuration of Prometheus is complex. With Prometheus Operator, K8s custom resources allow for easy customization of Prometheus, Alertmanager, and other components. Additionally, the Prometheus Operator Helm Chart includes all the dependencies required to stand up a full monitoring stack.
Prometheus Operator allows users to easily configure and manage Prometheus and related monitoring tools, including Grafana dashboards, Alertmanager, and exporters.
It provides a set of Kubernetes custom resources, such as Prometheus, Alertmanager, and ServiceMonitor, which can be used to configure and manage Prometheus instances in a Kubernetes environment.
Here are some of the benefits of using the Prometheus Operator:
Simplified configuration: With the Prometheus Operator, you can define and manage Prometheus instances using Kubernetes custom resources, which are easier to manage and maintain than traditional YAML manifests.
Automated management: The Prometheus Operator automates many of the tasks involved in deploying and managing Prometheus instances, such as scaling, rolling upgrades, and configuration changes.
Enhanced security: The Prometheus Operator provides built-in security features, such as authentication and authorization, that can help you secure your Prometheus instances.
Extensible monitoring: The Prometheus Operator makes it easy to extend the monitoring capabilities of Prometheus by integrating with other monitoring tools and services, such as Grafana and Kubernetes metrics.
To use the Prometheus Operator, you need to install it in your Kubernetes cluster and then create custom resources to define and configure your Prometheus instances.
Here are the basic steps:
Install the Prometheus Operator: You can install the Prometheus Operator using the helm package manager or by deploying the Kubernetes manifests directly.
Define a Prometheus resource: Use the Prometheus custom resource to define your Prometheus instance's configuration, such as the data retention period, alerting rules, and scrape targets.
Define an Alertmanager resource: Use the Alertmanager custom resource to define the configuration for your Alertmanager instance, such as the receivers and notification channels.
Define a ServiceMonitor resource: Use the ServiceMonitor custom resource to define the monitoring configuration for your applications running in Kubernetes.
Deploy and manage: The Prometheus Operator will create and manage your Prometheus instances and related components based on the custom resources you define.
By using the Prometheus Operator, you can simplify the deployment and management of Prometheus instances in Kubernetes and take advantage of Kubernetes’ native features for monitoring and scaling.
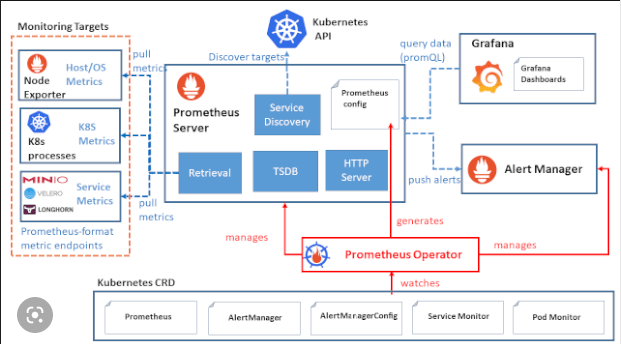
Understanding Prometheus Operator CRD
Prometheus Operator orchestrates Prometheus, Alertmanager and other monitoring resources by acting on a set of Kubernetes Custom Resource Definitions (CRDs).
Understanding what each of these CRDs does will allow you to better optimize your monitoring stack. The supported CRDs are:
Prometheus- Defines the desired state of a Prometheus Deployment
**Alertmanager- **Defines the desired state of a Alertmanager Deployment
**ThanosRuler- **Defines the desired state of a ThanosRuler Deployment
**ServiceMonitor- **Declaratively specifies how groups of Kubernetes services should be monitored. Relevant Prometheus scrape configuration is automatically generated.
**PodMonitor- **Declaratively specifies how groups of Kubernetes pods should be monitored. Relevant Prometheus scrape configuration is automatically generated.
**Probe- **Declaratively specifies how ingresses or static targets should be monitored. Relevant Prometheus scrape configuration is automatically generated.
**PrometheusRule- **Defines the desired state of a Prometheus Alerting and/or recording rules. Relevant Prometheus rules file is automatically generated.
**AlertmanagerConfig- **Declaratively specifies subsections of the Alertmanager configuration, allowing routing of alerts to custom receivers, and setting inhibit rules.
Installing Prometheus Operator using Helm
To kickstart your monitoring stack, the initial step would be to deploy Prometheus Operator and its corresponding Custom Resource Definitions (CRDs) in your Kubernetes cluster. In order to establish a complete monitoring stack, Prometheus necessitates the deployment of Grafana, node-exporter, and kube-state-metrics. The good news is that all of these essential components are included as dependency charts in the Prometheus Operator Helm Chart, which facilitates their automatic installation and integration with Prometheus Operator.
Before installing the Prometheus operator make sure your cluster is up and running since the Prometheus operator requires more resources then start the cluster with more resources using the — resource field.
minikube start --cpus 4 --memory 4096
The above command will create a cluster with 4cpus and a memory of 4096
$ helm install prom-operator-run prometheus-community/kube-prometheus-stack
Give it a minute or so to install all the Prometheus components after that run the
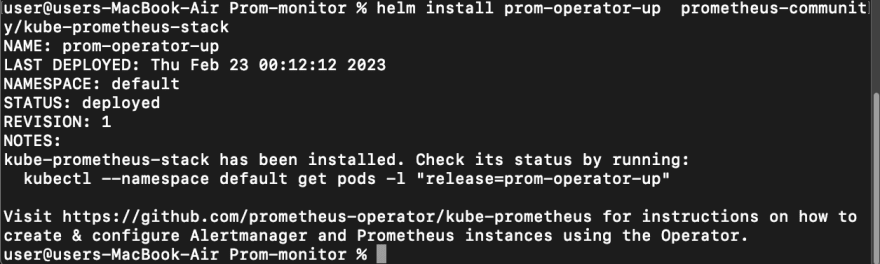
kubectl get pods
You should be able to see the different components installed by Helm. All the components from StatefullSet to the pods.
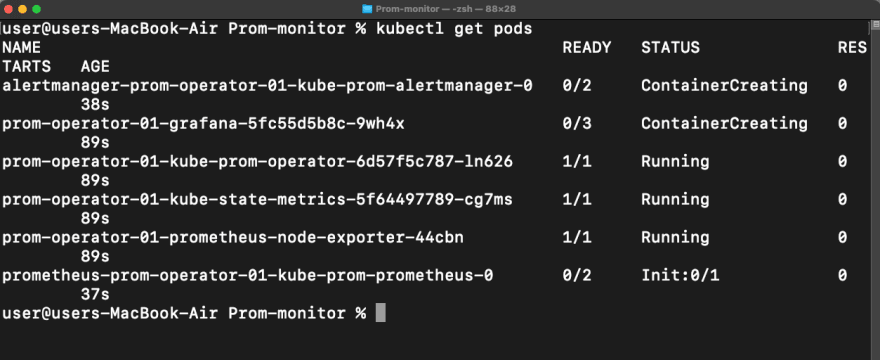
From the above, we see different pods created by Prometheus Operator. The operator creates other things also in our cluster you can view all by
kubectl get all
Configure-port forwarding for Grafana
Since we have already installed the different components of Prometheus using Prometheus Operator we can now be able to view the Grafana dashboard in our cluster using port forwarding since the service available is the ClusterIP
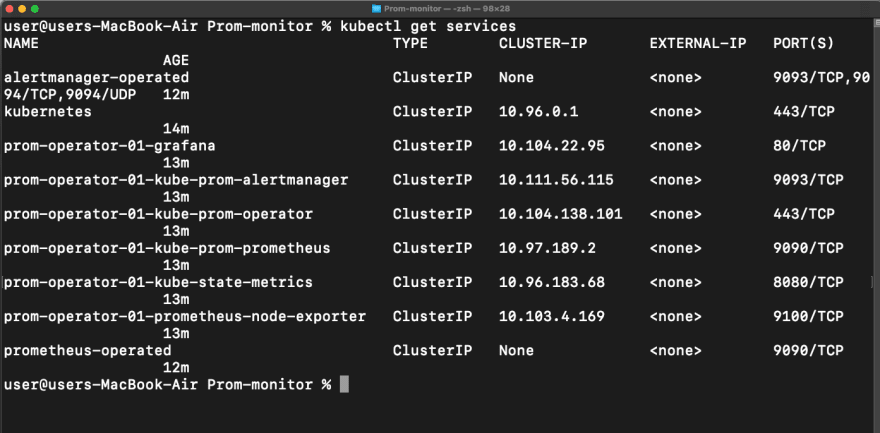
The command for accessing the Grafana UI interface is
kubectl port-forward svc/prom-operator-01-grafana 3000:80
Open the browser and go to localhost 3000 The prompt for Grafana login is displayed
Username = admin
Password = prom-operator
You can also be able to change the password.
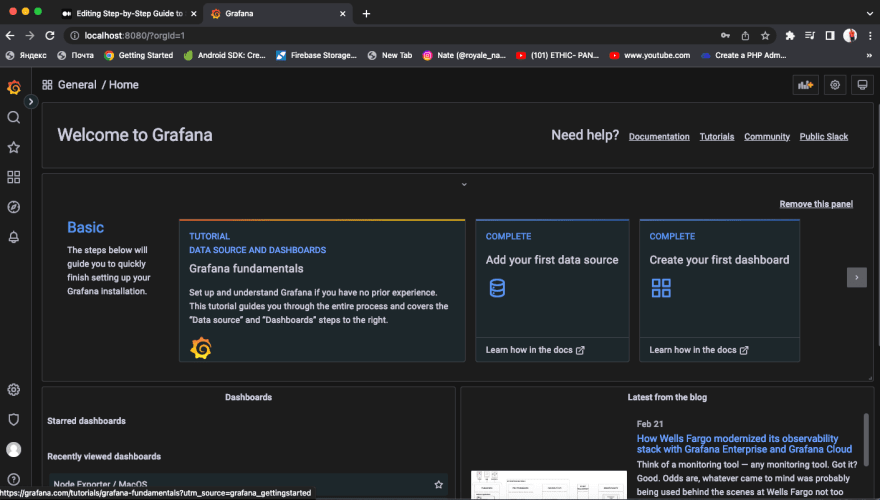
with the Grafana up and running we can be able to view different scraped data from Prometheus, edit the dashboard and so on.
You can also view the Prometheus UI also by port forwarding.
Important notes
Prometheus operator watches for namespaces for the Prometheus/Alertmanager CR. In most scenarios, it watches all namespaces but you can configure it to watch for a particular namespace as well. This can be changed by using the --namespaces= flag on the Prometheus operator namespace.
spec.selector.matchLabels MUST match your app’s name (k8s-app: my-app in our example) for ServiceMonitor to find the corresponding endpoints during deployment.
You can access the Prometheus UI by port-forwarding to the Prometheus container or creating a service on top of it. In a production scenario, you should not expose Prometheus since it should only act as a Grafana data-source. However, if you need to expose it is recommended to use an Ingress.
Make sure Prometheus instances are configured to store metric data in persistent volumes so that it is preserved in between restarts.
Next, we will upload an application in the Kubernetes cluster and be able to monitor it using Prometheus.

Top comments (0)