
We use a debugging tool, a 'debugger', to track what’s happening in our code line by line, so we can find out where our errors, 'bugs', live and kindly release those cute little guys from our code.

Node.js is 'an open-source, cross-platform, JavaScript runtime environment that executes JavaScript code outside of a browser.'^1 And VSCode has a built in debugging environment for debugging our Node code outside of the browser.^2
I know that when I started working in Node.js, I was already familiar with debugging in the browser with Google's DevTools when working with the front-end. Comparing the two helped me feel more comfortable with debugging in VSCode. It turns out the tools are very similar. Here's a side by side comparison (gif sources below):
 ^3
^3
 ^4
^4
in browser:
- open devtools panel
- set a breakpoint
- run code
- step through
with node in vscode:
- open debugger's panel
- add config / file path
- set a breakpoint
- start debugger
- step through
Similarities:
Open some kind of panel, set your breakpoints, start your debugger, step through, rinse and repeat.
Differences:
Location of panel, location of variable tracking, need for a configuration, setting file path, server starting.
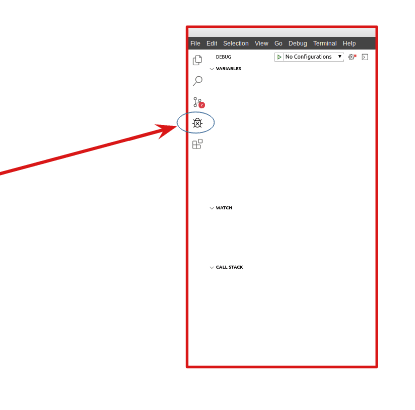
For both the browser DevTools and VSCode's debugging panel, we have to open some kind of tool. In VSCode, there's a little bug icon pointing the way or w/ CTRL + SHIFT + D
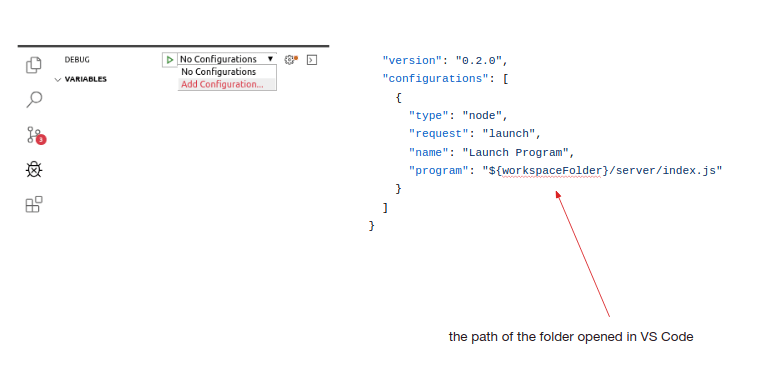
In VSCode, we have to set up our config and file path. This points our debugger to the file we need to be read. Usually some default will pop up when you click Add Config, but if not, there will be options for the kind of config needed.

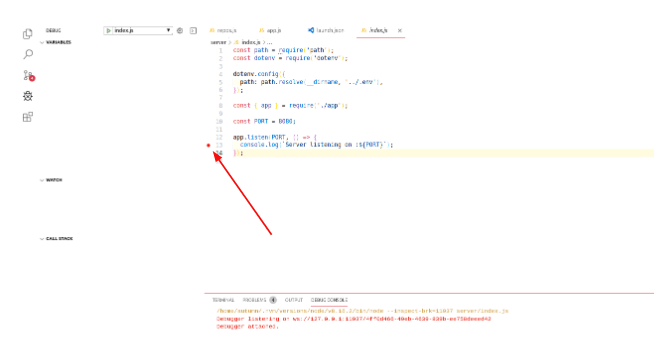
Then you can add any breakpoints you might need just like you would in Google's DevTools.
Start your debugger for the first time with the play button next to where you added your configs. You can restart your debugger later from the debugger's tool bar that will appear. This is also where you'll do your stepping and stopping and playing. If you're unfamiliar with these commands, see the 3rd link below.
Any variables in the file will be listed in the side panel and you can open up different parts by clicking on the down arrow, as seen below. This is just like the Scope panel in your DevTools.
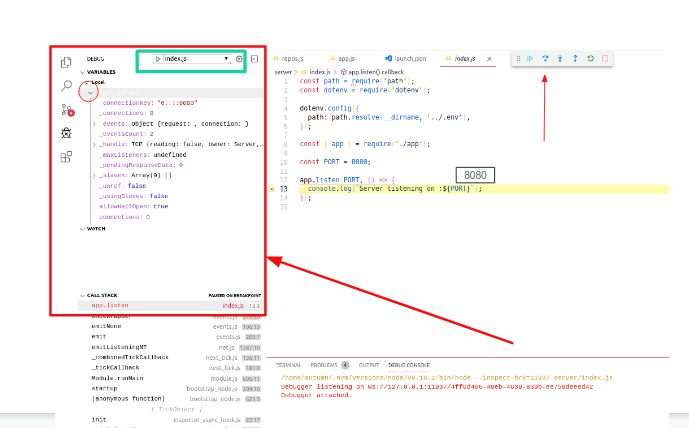
If you're using Node.js to build a server and have a config set up to the file that starts your server, the debugger will run this code and restart your server for you, which can become super useful when developing, so you aren't constantly running npm start. Once the server is started, you can go to your page and interact with the page as a user and access any console logs you might have set for GET and POST requests, etc. This will be output in the Debug Console pictured here:
open, config, break, start, step, rinse, repeat

[1]node.js docs
[2]node.js inspect
[3]DevTools gif
[4]VSCode gif

Top comments (2)
Live debugging in VSCode is a super underrated skill that many devs ignore
No joke. Code that used to take me weeks to write takes days now that I can debug JS in detail.
Awesome write up BTW 👍
They made it so simple to get started with debugging directly in VScode. Props to the VScode team! Good writeup :)