Debugging Laravel with XDebug and Visual Studio Code
iPhoto by Kevin Ku on Unsplash

If you have not installed Laravel sail you can read Laravel Sail installation and complete the Laravel Sail setup.
To debug Laravel code we need to do the following steps.
- 1. Enable Xdebug in Laravel Sail
- 2. VS Code Configure PHP Debug
- — 2.1 VS Code install PHP Debug extension
- — 2.2 Create a launch.json file
- 3. Start Debugging
1. Enable Xdebug in Laravel Sail
The Laravel Sail Docker comes with Xdebug support default. Xdebug is a popular and powerful debugger for PHP.
Open the .env configuration file and add the below configuration
SAIL_XDEBUG_MODE=develop,debug
Down and start the sail after the .env configuration update.
sail down
sail up
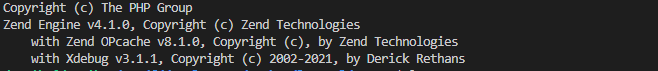
Test Xdebug is installed successfully by using sail php -v
2. VS Code Configure PHP Debug
2.1 VS Code install PHP Debug extension
Open VS code and search “PHP debug” in the extension search.
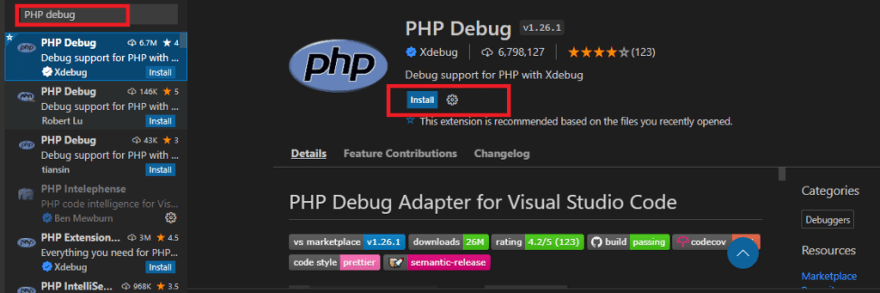
Install the PHP debug extension.
2.2 Create a launch.json file
After installtion click Run tab and click Add configuration
Run > Add Configuration

After that select the PHP environment. The launch.json file will be added to the root directory by VSCode.

Copy the below code and add it to your launch.json file
{
    "version": "0.2.0",
    "configurations": [
        {
            "name": "Listen for Xdebug",
            "type": "php",
            "request": "launch",
            "port": 9003,
            "pathMappings": {
                "/var/www/html": "${workspaceFolder}"
            }
        }
    ]
}
3. Start Debugging
Click the line number to add your breakpoints.

Click the Run tab and select the Start Debugging
Run > Start Debugging (or) F5

In the browser open route of the breakpoint added the controller. In VS code your breakpoint is highlighted.

Start to debug your code by using debug toolbar. More general information on debugging with VS Code can be found on https://code.visualstudio.com/docs/editor/debugging.
- Continue / Pause F5
- Step Over F10
- Step Into F11
- Step Out Shift+F11
- Restart Ctrl+Shift+F5
- Stop Shift+F5
Thank you for reading.
Stay tuned for more!
Follow me at balajidharma.medium.com.

Top comments (0)