Full stack observability: LogRocket, DataDog, Honeycomb

TL;DR
In this post, we will set up an observable system for a React/Redux app and a Node.js backend deployed with Docker across the stack and see how it helps us identify and fix problems.
We will cover:
- LogRocket with React/Redux integration to track frontend application
- DataDog with Docker integration to monitor uptime/threshold-based alerts and Node.js APM
- Honeycomb with backend server logs integration for error responses
Getting started with observability
Observability is a measure of how well we can understand a system from the work that it does. It also helps to explain why a system is behaving a certain way.
Observability is often confused with monitoring. Monitoring is a way to identify known issues while observability lets you know why an issue was there in the first place.
Traditionally, apps were server-side rendered and the server was more or less set up and controlled by the application developer. So, monitoring was focussed on the server. Now with client-side javascript apps (React, Vue, Angular, etc.) and serverless backends, things are changing with respect to how errors can be identified and handled.
We cannot predict when or which part of the application will fail. Therefore, at any point in time, we need a way to quickly get visibility into how the app is performing and handling errors.
Need for context
We need context across the full stack — frontend, backend, and infrastructure. It’s not just a matter of the code we write, but also the underlying infrastructure. It too can go wrong in many ways. There simply must be a quick way out.
To determine what went wrong with an app, we need as much data as possible about the entire stack to finalize the solution. By design, an observable system should emit metrics/logs/traces.
React with LogRocket
LogRocket helps you understand user behavior by capturing logs and session recordings from your app.
Error tracking
Despite all the end-to-end testing that goes into production builds, error tracking is still important. Post error tracking, you need to have an easy way to:
- Identify which section of users it is affecting
- Reproduce the same errors in a development setup
- Filter out the noise to get a quick overview of what’s happening
LogRocket helps you do all the above easily.
React integration
LogRocket comes with built-in integrations for popular state management libraries like Redux, MobX, and Vuex. In this example, I’m going to use the Redux integration. The setup process is pretty simple. Start off with signing up on https://app.logrocket.com
- Install with npm:
npm install — save logrocket - Initialize LogRocket in your app: https://medium.com/media/1b3177a212b3f816af220a346607435c/href
- Add the Redux middleware https://medium.com/media/e412802f09c0f6dbe21cee7b9f12803d/href
As soon as the integration is set up, LogRocket will start receiving events and you can replay them on your dashboard.

Identify users
We also need to tag each event to a user. So once a user is authenticated, it’s just a matter of triggering the identify method.
https://medium.com/media/aa76ab920e5f8f8df0ccfbeab397d579/href
Great! Now we have the basic system up and running to collect data from the frontend app.
Tracking bad deployment
With React applications (or any JavaScript framework for that matter), unless used with Typescript, the likelihood of uncaught exceptions coming into the app at runtime is high.
For example, let’s look at the case of a bad accessing of a list.
https://medium.com/media/1722fb7a527c7a3558b5b44b30437c3b/href

In the above example, some code was written assuming that the response from the backend will always return a list of todos with its corresponding metadata.
In this case, the server returned an empty array and resulted in an error.
Anything can go wrong with assumptions. The ability to identify exceptions post-deployment is crucial for quick recoveries. Now, the action is to add a try catch block and handle the case of empty responses carefully.
Uptime monitor and tracing with DataDog
DataDog seamlessly aggregates metrics and events across the full DevOps stack. Assuming a typical microservice architecture, the React app is Dockerized for deployment in any cloud provider.
Apart from the cloud provider’s guarantee of the uptime, your Docker container running inside can have its own downtime due to a number of reasons.
It could be as simple as a badly coded server causing a crash to as complicated as high usage of CPU/RAM causing slow responses. In these cases, DataDog comes to the rescue by collecting as much information as possible about your deployment.
Docker integration
Similar to LogRocket, DataDog comes with built-in integrations for the DevOps stack. In this post, we are covering a typical Docker deployment. Head over to installation instructions of DataDog Agent on Docker.
https://medium.com/media/b14ef97a258b007697939aa877800541/href
Note: replace with your DataDog API Key.
Track if the server is up by using docker ps.
Now we can set up a dashboard to observe different metrics of the underlying cloud cluster where the application’s docker container is running.

Threshold a lerts
We have to measure a few metrics to track if the Docker container is running the way it should. Some of the metrics to collect are:
- CPU usage
- RAM usage
- Docker container running status
- System uptime
There are a whole lot of other metrics that can be collected. But the above can give us a pretty good sense of what’s going on.

Monitors
DataDog gives you the ability to create monitors that actively check metrics, integration availability, network endpoints, and more. Once a monitor is created, you are notified when its threshold conditions are met.
You can set up monitors when a metric (like response time, CPU/RAM usage) crosses a threshold and can be used to trigger alerts to you and your team.
The actual use case of these monitors kicks in when, for example, you are making an unoptimized database query. This takes a lot of CPU to process and becomes a bottleneck to your other microservices in the same cluster.

APM — dd-trace
Tracing brings the benefits of visibility when the application stack grows into a multi-container setup in a microservice architecture. A web/mobile client contacts different services for different use-cases and it quickly gets complex to handle.
Let’s look at a simple Node.js express integration with dd-trace to see how it helps.
Enable APM in DataDog Agent running on the same host as your Node.js Docker container.
https://medium.com/media/39c8f312932ec02e9c2f2610cab73955/href
Place the below code at the top of your Node.js server to start instrumenting code.
https://medium.com/media/c7c7aa1ebb9f1282f82d3b7f9f52de61/href
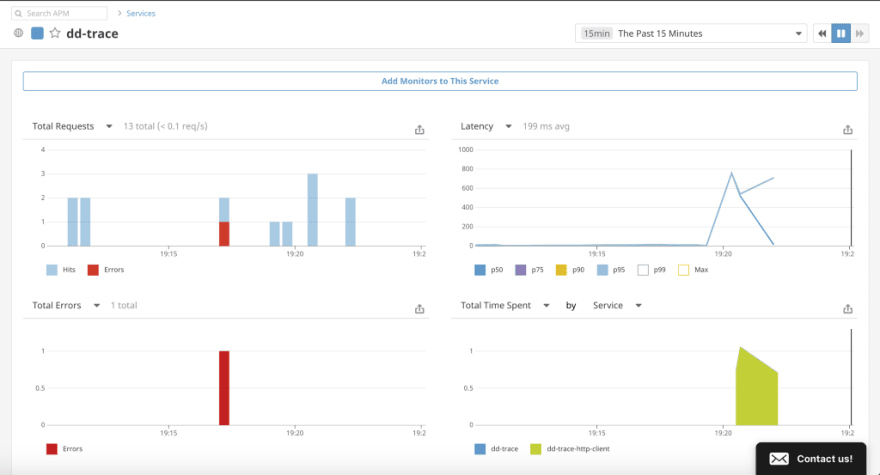
With this setup, you can now trace request/response on your backend server.
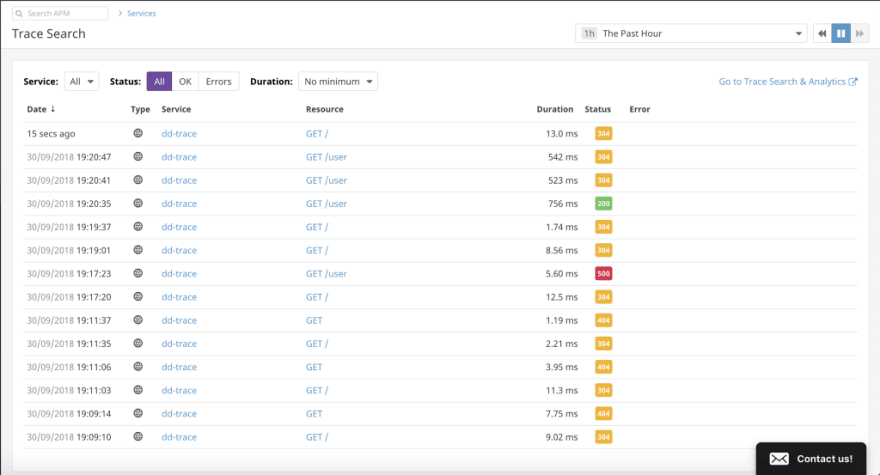
We can also look at the graph of the number of req/s, latency, errors, total time spend etc. What this tells us is that, if there is a sudden increase in any of these metrics, we can trace an individual request to see what is going wrong.
A good example would be to trace the call made to the database to fetch a large amount of data or an async API call to see how long it takes to respond.
If there are multiple requests branching out on an endpoint, you can uniquely ID each request. Trace data can guide on your development to optimize parts of the codebase. Having visibility into your processes makes a considerable difference when optimizing for those milliseconds as you scale your application.
Visualize with Honeycomb
When there’s so much data to be analyzed, it’s generally good to zoom out and get a visual representation of what’s going on with the application. While LogRocket helps you capture errors in your frontend, Honeycomb can be set up to capture metrics from the backend.
Honeycomb integrations are fast as it is environment agnostic and it spits out JSON and allows processing with JSON.
Node.js integration
Get started by installing honeycomb’s node.js integration.
npm install honeycomb-beeline — save
and by placing the below code snippet at the top of your Node.js server code.
https://medium.com/media/f618f240944c04024251c7d17517740b/href
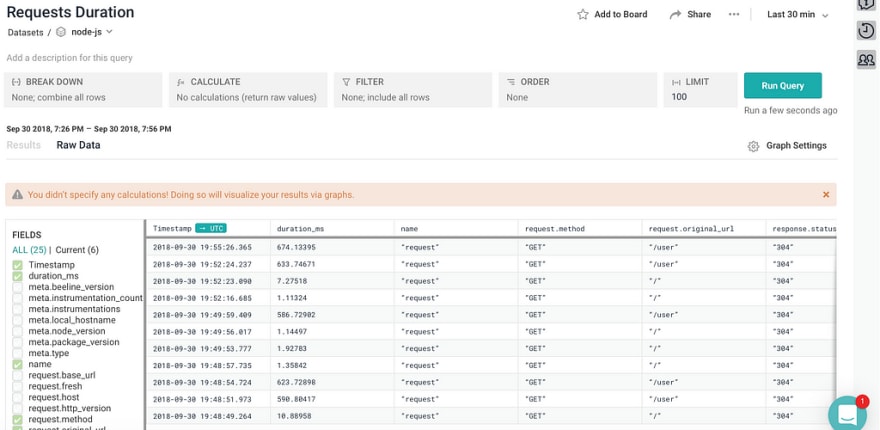
The Node app had a few endpoints. Honeycomb automatically parses these request metadata into a nice schema which can then be queried upon including payload. We can also apply filters, break down the data by different parameters.
For example, if we want to group by the number of requests sent to a particular URL, we can apply the breakdown on that parameter and run the query.
Flexible schema
More often than not, most tooling will have a rigid schema that restricts the developer from asking more questions. Honeycomb has a flexible schema and allows you to put arbitrary data as long as its JSON.
Pro Tip: Honeycomb lets you manage the schema. What this allows you to do is assign specific data types to particular columns (if type conversion is allowed, of course) and therefore you can apply a bunch of comparison operators like >, <, >=, <= and =.
Collaborative data analysis
With the team-based approach, Honeycomb lets developers in a team, analyze if their application is working fine. Anybody in the team can query to see if their recent deployments are working fine based on response times and status codes.
With fine-grained data, time-based graphical visualization helps developers to keep asking different questions until they pinpoint the original problem.
Honeycomb data is real real-time and aggregates data at read time.
Recently, Honeycomb also introduced Tracing to get deeper insights like an overview of which methods are slow, the API request structure, and sync vs async decisions to parallelize certain requests. Here’s a request tracing example taken from Honeycomb.

Adding safeguards
We can bare minimum follow the best practices across the stack to minimize what can go wrong in production. Basically prudent error handling, stable infrastructure provider and up to date tooling will ensure basic safeguard for your application. This will be an ongoing process as libraries/tools keep getting updated and there has to be a consistent deployment of such updates to your application.
Summary
The idea is to leverage built-in integrations of all the tools. Plugin integration for common frameworks/libraries across the stack is pretty good in the above toolset.
In a complex and distributed system, it is imperative that there is a high degree of observability. Obviously, some decisions can be automated, like restarting your docker container because of your cloud vendor’s downtime or handling errors in frontend client.
True, observability comes at a cost but helps solve mission-critical business issues at a faster rate as the application/business scales.
Plug: LogRocket, a DVR for web apps
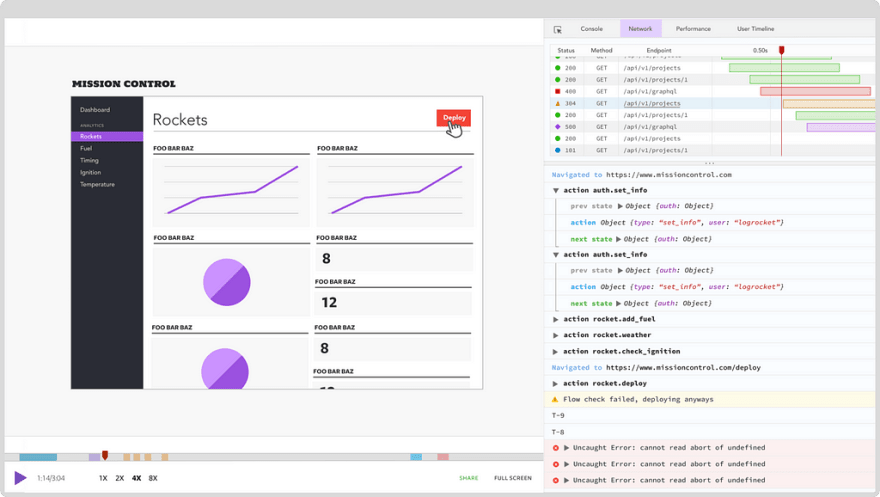
LogRocket is a frontend logging tool that lets you replay problems as if they happened in your own browser. Instead of guessing why errors happen, or asking users for screenshots and log dumps, LogRocket lets you replay the session to quickly understand what went wrong. It works perfectly with any app, regardless of framework, and has plugins to log additional context from Redux, Vuex, and @ngrx/store.
In addition to logging Redux actions and state, LogRocket records console logs, JavaScript errors, stacktraces, network requests/responses with headers + bodies, browser metadata, and custom logs. It also instruments the DOM to record the HTML and CSS on the page, recreating pixel-perfect videos of even the most complex single page apps.

Top comments (0)