
Introduction
For those who do not know: The NEM node uses H2 to store data. H2 is an open-source, relational database management system written in Java (NIS client is also written in Java). H2 supports a subset of the SQL standard and provides a fast, in-memory database engine with persistence capabilities. H2 is a popular choice for embedded databases, especially for applications written in Java, due to its small footprint and easy of use.
In this article, I will show you how to extract the data stored in the NEM node database. This way you can export (e.g. in the form of CSV) all transactions, transactions of a given address, check the number of known accounts, blocks, and create various statistics/charts based on that data. Let’s go :)
Get snapshot of the NEM node database
First, you need a current database file to connect to. To do this, you must synchronize the NEM node (instructions for setting up the node can be found here). To speed up the synchronization process, you can use the latest presynchronized database dump available at bob.nem.ninja. You can get it from here - it’s from August and you can use it if you just want to play and do not need up-to-date data.
By default, the H2 database file is located in: /nem/nis/data directory (for example: /home/user/nem/nis/data/nis5_mainnet.mv.db).
The H2 is a single-user database. To connect to it, you must stop the node (in the last part of the article I will present an experimental way to work around this limitation). I suggest copy the database file and use it.
Connection to the database with H2 Client
Now that you have a snapshot of the database, we can connect to it. To connect to the H2 database, you can use multiple clients. Here I'll show you how to use the official H2 client which runs in the browser. You should get version 1.4.200 which is compatible with NEM database dump. To connect to the database, leave the user and password blank. As JDBC URL enter the path to the file (without the mv.db extension), for example:
jdbc:h2:/home/user/nem/nis/data/nis5_mainnet_copy

Once the connection is established, you can check the table structure in the H2 client, which will help you write SQL queries. If you are not familiar with the SQL language, you can find numerous tutorials on the Internet.

With the H2 client, you can export the results of SQL queries using the csvwrite function. This allows you to export CSV files for further analysis. Example of usage:
CALL CSVWRITE('/home/user/result_export.csv', '(sql_query)');
Sample SQL queries
Now we can start querying data. I'd like to point out, that the NEM client does a lot of calculations when loading blocks from the database (for example, about the levy associated with the mosaic on specific transactions and blocks or harvested blocks). So, if you want for example an accurate account balance (which depends on a few factors) you should query this information via the node API. Querying the database is good for getting general statistics and information about transactions. Below are examples of queries.
Retrieve all registered namespaces (including those that have already expired):
SELECT fullname, height, a.printablekey
FROM namespaces n
LEFT JOIN accounts a ON a.id = n.ownerid;
All known addresses count:
SELECT count(*) FROM accounts;
Query last block height:
SELECT max(height) FROM blocks;
Retrieve all transfer transactions with timestamp, block height, hash, multi-sig hash (if multi-sig), sender, recipient, transferred XEM amount and message:
SELECT
    block.timestamp + 1427587585 AS timestamp,
    block.height,
    tran.transferhash AS hash,
    multisig.transferhash AS multisig_hash,
    sender.printablekey AS sender,
    recipient.printablekey AS recipient,
    CASE WHEN tranmosaics_xem.quantity IS NULL AND tranmosaics_other.quantity IS NULL THEN CAST(tran.amount/1000000.0 AS numeric(20,6))
            WHEN tranmosaics_other.quantity IS NULL THEN CAST(tranmosaics_xem.quantity/1000000.0 * tran.amount/1000000.0 AS numeric(20,6))
            ELSE 0.000000
   END AS xem_amount,
   tran.messagetype,
   tran.messagepayload
FROM transfers tran
LEFT JOIN accounts sender ON tran.senderid = sender.id
LEFT JOIN accounts recipient ON tran.recipientid = recipient.id
LEFT JOIN blocks block ON tran.blockid = block.id
LEFT JOIN multisigtransactions multisig ON tran.id = multisig.transferid
LEFT JOIN transferredmosaics tranmosaics_xem ON tran.id = tranmosaics_xem.transferid AND tranmosaics_xem.dbmosaicid = 0
LEFT JOIN transferredmosaics tranmosaics_other ON tran.id = tranmosaics_other.transferid AND tranmosaics_other.dbmosaicid != 0;
Here are a few explanations to query above:
Why do we add 1427587585 to the timestamp? This is the number of seconds from the NEM genesis block (March 29, 2015 at 00:06:25 UTC). All timestamps in the database are the number of seconds from the NEM genesis block. To convert the date to a real-world timestamp, we need to add the timestamp of the genesis block.
The XEM amount is calculated as above, since XEM can be transferred as a V1 transfer (mosaics array field is empty and the XEM amount transferred is in the amount field) or V2 transfer (mosaics array is not empty) where the amount field acts as multiplier and we should take the XEM quantity from mosaics array and multiply it with amount. You can check example calculations for specific transactions here to get an idea.
Connection to the database from Python code
Now that we have learned the structure of the database tables (thanks to H2 Console) and performed some queries, we will learn how to connect to the database using Python code.
To connect we will use jaydebeapi. We will need also h2-1.4.200.jar driver available here. Here sample code:
import pandas as pd
import matplotlib.pyplot as plt
import matplotlib.dates as mdates
import jaydebeapi

connection = jaydebeapi.connect(
    "org.h2.Driver",
    "jdbc:h2:/home/user/nem/nis/data/nis5_mainnet_copy",
    ["", ""],
    "/home/user/nem/nis/data/h2-2019-10-14/h2/bin/h2-1.4.200.jar"
)

query = """SELECT block.timestamp + 1427587585 AS timestamp, CAST(tran.transferhash as VARCHAR) AS hash
FROM transfers tran
LEFT JOIN blocks block ON tran.blockid = block.id"""

cursor = connection.cursor()
cursor.execute(query)
result = list(cursor.fetchall())
cursor.close()
connection.close()
In query above we have two columns:
-
timestampof transfer transaction -
hashof transfer transaction
All values are now in the result field. We can convert it to pandas DataFrame object and generate charts using it. Thank you NineLives for showing this great library in this article about his Journey with Mongodb. Please have a look if you haven't already!
Query above is simple but will allow us to build daily transfer transactions chart. To do that we have to create DataFrame from SQL result:
data_frame = pd.DataFrame(result, columns=['Timestamp', 'Hash'])
data_frame["Datetime"] = pd.to_datetime(data_frame["Timestamp"], unit = "s")
data_frame["Date"] = data_frame["Datetime"].dt.date
And next group by Date field:
grouped_by_day = pd.DataFrame().assign(Date=data_frame['Date'], Transactions=1)
grouped_by_day = grouped_by_day.groupby(['Date']).count()
Now when we have grouped results we can draw a chart:
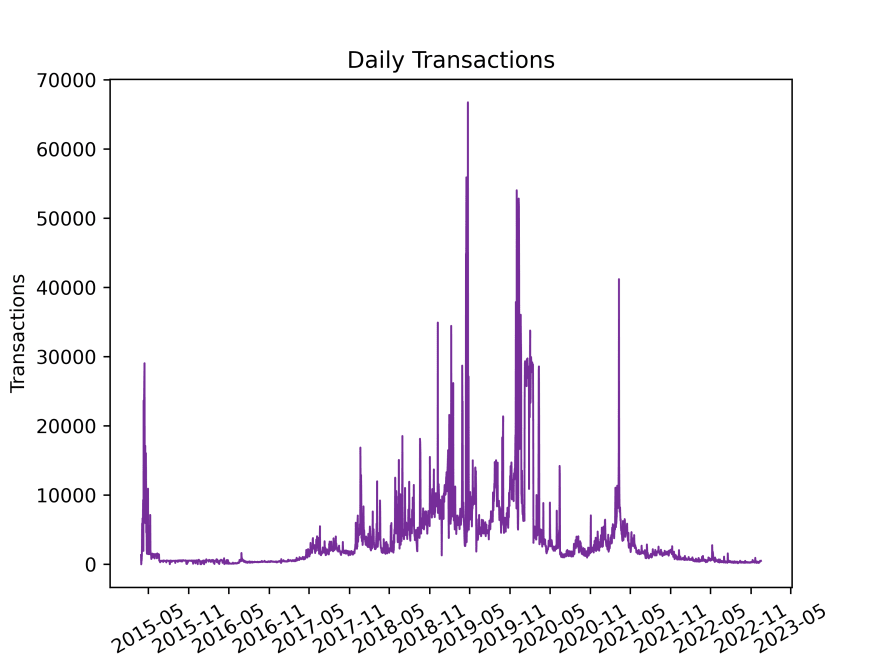
fig, ax = plt.subplots()
grouped_by_day.plot(ax=ax, color='#762D99', linewidth = '1')
ax.set_title('Daily Transactions')
ax.xaxis.set_major_locator(mdates.MonthLocator(interval=6))
ax.get_legend().remove()
plt.xticks(rotation=30)
plt.xlabel("Date")
plt.ylabel("Transactions")
plt.savefig('/home/user/images/daily_transactions.png', dpi=600)
plt.show()
Result:
You can also filter data by date and generate report from last 12 months:
last_year_data_frame = data_frame['Datetime'] >= '2021-12-18 00:00:00'
last_year_data_frame = data_frame.loc[last_year_data_frame]
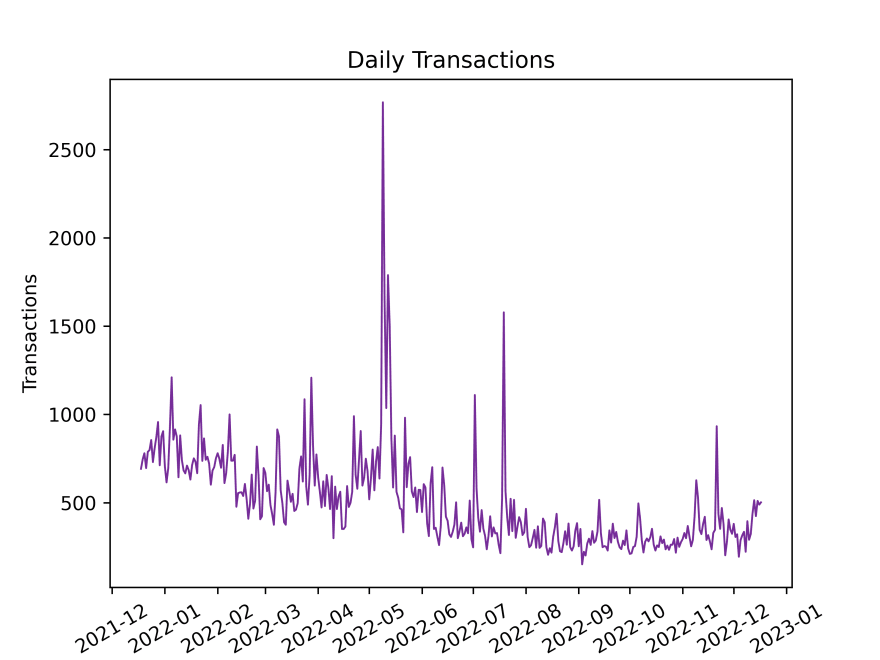
Those examples should give you an idea. You can generate many more charts based on data from database. Have fun :)
Connection to the database of the running node (experimental)
Previously I mentioned that H2 in embedded mode is single-user database. That's why you can't connect to database of running node. I looked though the possible switches of the H2 database in configuration and I found information about a configuration that allows you to connect to the base of the running node. It's called Automatic Mixed Mode. To enable this, modify the node configuration in the db.properties file by adding AUTO_SERVER=TRUE to the connection string:
jdbc.url=jdbc:h2:${nem.folder}/nis/data/nis5_${nem.network};DB_CLOSE_DELAY=-1;AUTO_SERVER=TRUE
The same parameter AUTO_SERVER=TRUE should be added when connecting to the database from H2 console client.
jdbc:h2:/home/user/nem/nis/data/nis5_mainnet;AUTO_SERVER=TRUE
This configuration is not tested in a long node run, so use it carefully because it’s likely that the node database can be corrupted.
Summary
In this article, you learned how you can connect to the NEM node H2 database using client and from Python code. We generated also simple charts. I hope it will be helpful for you.
Have a look! Feedback is always appreciated!

Top comments (0)