
This will be the conclusion of my journey of exploring polyglot data visualization. As a scientific software engineer, there are many chances to cope with various kinds of environments where scientists are keen on. Personally, I prefer to using javascript because it is platform agnostic.
I have one post how to communicate between python and javascript/java thanks to BeakerX extension.

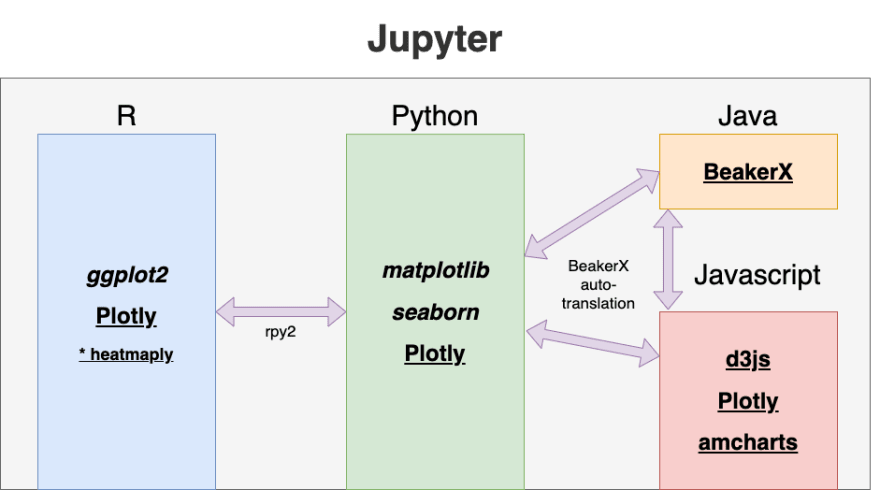
Today we take a look at how to exchange data between R and Python cells in Jupyter. The summary figure shows how to share data among R, Python, Java, Javascript in Jupyter notebook.
rpy2 (https://rpy2.readthedocs.io/en/latest/)
rpy2 is designed to facilitate the use of R by Python programmers. R objects are exposed as instances of python classes and R functions as bound methods to those objects.
In order to use rpy2 in jupyter notebooks, we need to install them first. Please, refer https://rpy2.readthedocs.io/en/latest/overview.html#installation.
Then, enable it with load_ext magic in the jupyter cell.
%load_ext rpy2.ipython
For the convenience, let's put this extension in ipython_config.py file which is located in ~/.ipython/profile_defaults. If there is no config file in the location, please, create ipython_config.py. Then, paste the below content.
c.IPKernelApp.extensions = [
    'rpy2.ipython'
]
Now you can freely use the magics provided by rpy2. Let's check the output of pi from R.
import rpy2.robjects as robjects
pi = robjects.r['pi']
pi[0]
-
Create a dataframe in Python
import pandas as pd python_df = pd.DataFrame({'A': [2, 3, 5, 2, 3, 4, 6, 2, 5, 9], 'B': [4, 2, 4, 6, 2, 4, 6, 7, 3, 5]}) print(python_df) -
Use the dataframe in R with -i flag in the R magic
%%R -i python_df # Pass the specific dataframe to R using the -i option plot(python_df, main="Plotting a Python Dataframe in R", col="red", pch=12) -
Export R variables with -o flag in the R magic
%%R -o model -o coef # R to Python model <- lm(B ~ A, data=python_df) coef <- model$coefficients -
Use the exported R variables with rpy2
import rpy2.robjects as robjects

print(model)
print(type(model))

print(dict(model.items()))
Normally, the exported R dataframe is automatically translated as a panda's dataframe in Python.
%%R -o cars_df

cars_df <- mtcars
# print(cars_df)
from beakerx import *
from beakerx.object import beakerx

beakerx.pandas_display_default()
cars_df
However, there is no direct way from R to Java/Javascript now. Hopefully, BeakerX team will provide the auto-translation feature for R sooner or later.
Here is the gist including all the snippets shown in the article.
Happy coding!

Top comments (0)