*Memos:
- My post explains Resize().
- My post explains RandomRotation().
- My post explains OxfordIIITPet().
You can set InterpolationMode as shown below:
*Memos:
- In PyTorch to resample(resize) data, there are 9 interpolation modes Nearest(Nearest-neighbor) which matches the OpenCV’s INTER_NEAREST which is buggy, Nearest-exact(Nearest-neighbor) which matches the Scikit-Image's and PIL's(Pillow's) nearest neighbour which isn't buggy, Linear, Bilinear, Trilinear, Bicubic, Box, Hamming and Area according to Source code for torchvision.transforms.functional and torch.nn.functional.interpolate. *I will say again that Nearest is buggy while Nearest-exact isn't buggy.
-
interpolationargument withantialiasargument is for Resize(), RandomResizedCrop(), etc. -
interpolationargument withoutantialiasargument is for RandomRotation(), RandomAffine(), RandomPerspective(), ElasticTransform(), RandAugment(), TrivialAugmentWide(), AutoAugment(), AugMix(), etc.
from torchvision.datasets import OxfordIIITPet
from torchvision.transforms.v2 import Resize, RandomRotation
from torchvision.transforms.functional import InterpolationMode
origin_data = OxfordIIITPet(
root="data",
transform=None
)
import matplotlib.pyplot as plt
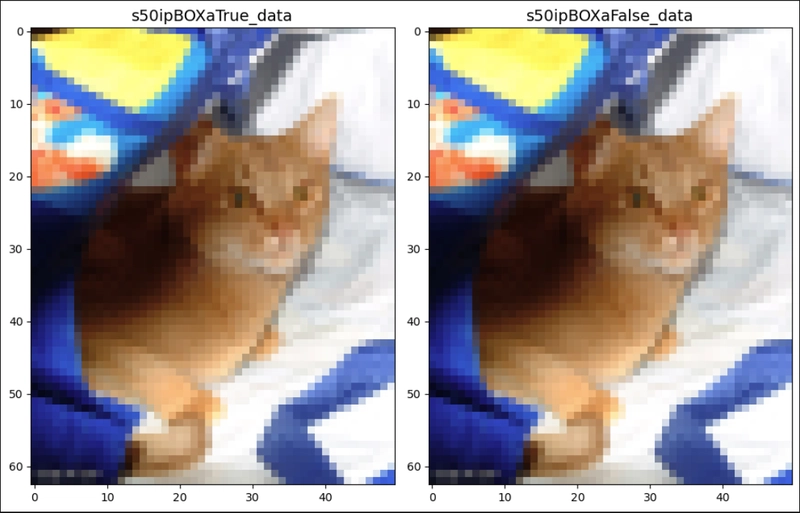
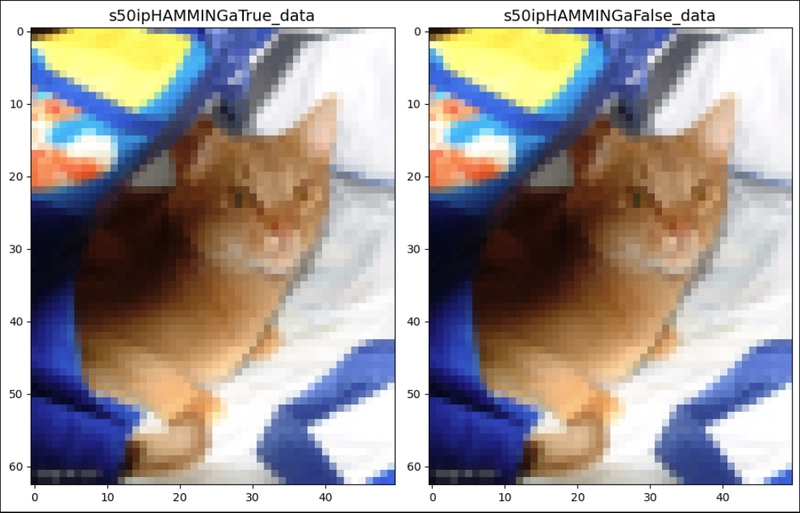
def show_rimages(im, s=None, ip=None):
title = "s" + str(s) + "ip" + str(ip).split(".")[1] + "a"
title1 = title + "True_data"
title2 = title + "False_data"
plt.figure(figsize=[10, 8])
for i in range(1, 3):
plt.subplot(1, 2, i)
r = Resize(size=s, interpolation=ip,
antialias=True if i == 1 else False)
plt.title(label=title1 if i == 1 else title2, y=1, fontsize=14)
plt.imshow(X=r(im))
plt.tight_layout()
plt.show()
def show_rrimages(im, d=None, ip=None):
plt.figure(figsize=[10, 8])
for i in range(2):
if isinstance(d, collections.abc.Sequence):
d1 = str(d[0]) if d[0] >= 0 else "n" + str(-1*d[0])
d2 = str(d[1]) if d[1] >= 0 else "n" + str(-1*d[1])
dpart = d1 + d2 if "n" in d2 else d1 + "_" + d2
else:
dpart = str(d)
title = "d" + dpart + "ip" + str(ip[i]).split(".")[1] + "_data"
plt.subplot(1, 2, (i+1))
rr = RandomRotation(degrees=d, interpolation=ip[i])
plt.title(label=title, y=1, fontsize=14)
plt.imshow(X=rr(im))
plt.tight_layout()
plt.show()
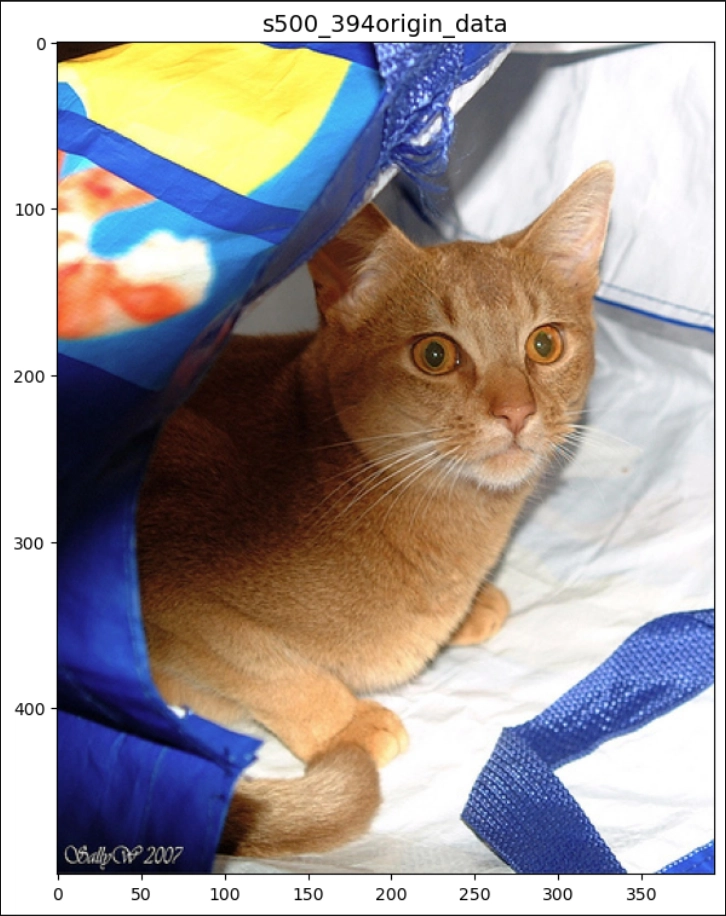
plt.figure(figsize=[7, 9])
plt.title(label="s500_394origin_data", fontsize=14)
plt.imshow(X=origin_data[0][0])
plt.show()
print()
show_rimages(im=origin_data[0][0], s=50, ip=InterpolationMode.NEAREST)
show_rimages(im=origin_data[0][0], s=50, ip=InterpolationMode.NEAREST_EXACT)
show_rimages(im=origin_data[0][0], s=50, ip=InterpolationMode.BILINEAR)
show_rimages(im=origin_data[0][0], s=50, ip=InterpolationMode.BICUBIC)
show_rimages(im=origin_data[0][0], s=50, ip=InterpolationMode.BOX)
show_rimages(im=origin_data[0][0], s=50, ip=InterpolationMode.HAMMING)
show_rimages(im=origin_data[0][0], s=50, ip=InterpolationMode.LANCZOS)
print()
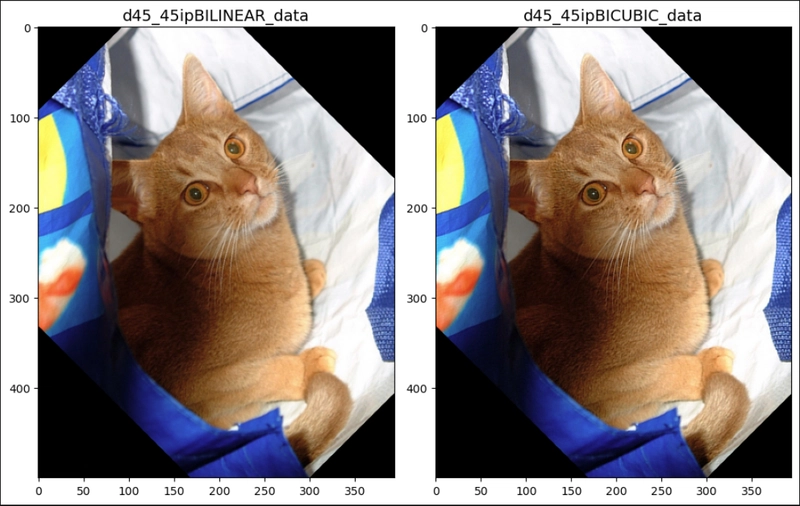
show_rrimages(im=origin_data[0][0], d=[45, 45],
ip=[InterpolationMode.NEAREST, InterpolationMode.NEAREST_EXACT])
show_rrimages(im=origin_data[0][0], d=[45, 45],
ip=[InterpolationMode.BILINEAR, InterpolationMode.BICUBIC])


Top comments (0)