Why Load Testing Matters in Nebula Graph?
The load testing for the database needs to be conducted usually so that the impact on the system can be monitored in different scenarios, such as query language rule optimization, storage engine parameter adjustment, etc.
The operating system in this article is the x86 CentOS 7.8.
The hosts where nebula is deployed are configured with 4C 16G memory, SSD disk, and 10G network.
Tools Needed for the Load Testing
nebula-ansible deploys Nebula Graph services.
nebula-importer imports data into Nebula Graph clusters.
k6-plugin is a K6 extension that is used to perform load testing against the Nebula Graph cluster. The extension integrates with the nebula-go client to send requests during the testing.
nebula-bench generates the LDBC dataset and then imports it into Nebula Graph.
ldbc_snb_datagen_hadoop is a LDBC data generator.
Load Testing Process Overview
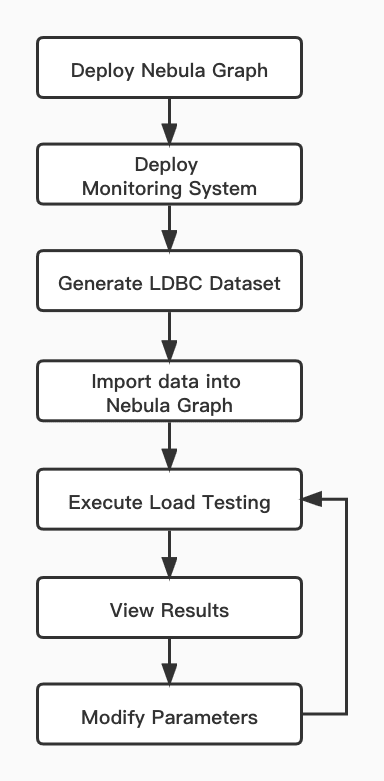
The load testing conducted in this article uses the LDBC dataset generated by ldbc_snb_datagen. The testing process is as follows.

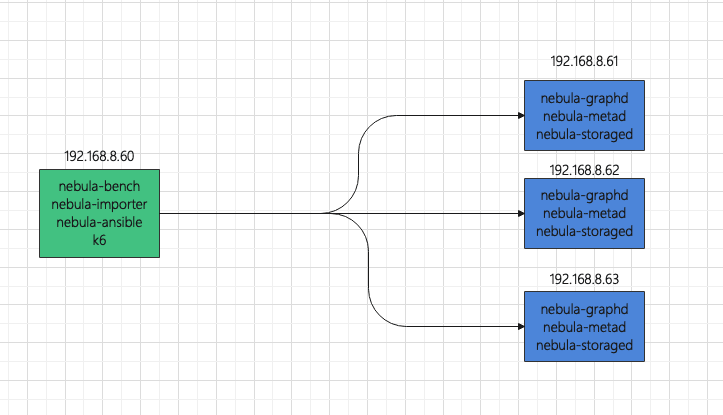
To deploy the topology, use one host as the load testing runner, and use three hosts to form a Nebula Graph cluster.

To make monitoring easier, the load testing runner also deploys:
Prometheus
Influxdb
Grafana
node-exporter
The hosts where Nebula Graph is installed also deploy:
node-exporter
process-exporter
Load Testing Steps
Use nebula-ansible to deploy Nebula Graph
Set up SSH login without passwords a. Log in 192.168.8.60, 192.168.8.61, 192.168.8.62, and 192.168.8.63 respectively. Create a vesoft user and join in sudoer with NOPASSWD. b. Log in 192.168.8.60 to set up SSH.
ssh-keygen

ssh-copy-id vesoft@192.168.8.61
ssh-copy-id vesoft@192.168.8.62
ssh-copy-id vesoft@192.168.8.63
Download nebula-ansible, install Ansible, and modify the Ansible configuration.
sudo yum install ansible -y
git clone https://github.com/vesoft-inc/nebula-ansible
cd nebula-ansible/
The following is an example of inventory.ini.
[all:vars]
# GA or nightly
install_source_type = GA
nebula_version = 2.0.1
os_version = el7
arc = x86_64
pkg = rpm

packages_dir = {{ playbook_dir }}/packages
deploy_dir = /home/vesoft/nebula
data_dir = {{ deploy_dir }}/data

# ssh user
ansible_ssh_user = vesoft

force_download = False

[metad]
192.168.8.[61:63]

[graphd]
192.168.8.[61:63]

[storaged]
192.168.8.[61:63]
Install and deploy Nebula Graph.
ansible-playbook install.yml
ansible-playbook start.yml
Monitor hosts
Using docker-compose to deploy a monitoring system is convenient. Docker and Docker-Compose need to be installed on the hosts first.
Log in 192.168.8.60
git clone https://github.com/vesoft-inc/nebula-bench.git

cd nebula-bench
cp -r third/promethues ~/.
cp -r third/exporter ~/.


cd ~/exporter/ && docker-compose up -d

cd ~/promethues
# Modify the exporter address of monitoring nodes
# vi prometheus.yml
docker-compose up -d

# Copy exporter to 192.168.8.61, 192.168.8.62, and 192.168.8.63, and then start docker-compose
Configure the Grafana data source and dashboard. For details, see https://github.com/vesoft-inc/nebula-bench/tree/master/third.
Generate the LDBC dataset
cd nebula-bench

sudo yum install -y git \
                    make \
                    file \
                    libev \
                    libev-devel \
                    gcc \
                    wget \
                    python3 \
                    python3-devel \
                    java-1.8.0-openjdk \
                    maven

pip3 install --user -r requirements.txt

# Using `snb.interactive.1` parameter in ldbc_snb_datagen_hadoop, for more infor https://github.com/ldbc/ldbc_snb_datagen_hadoop/wiki/Configuration

python3 run.py data

# Date generated by mv

mv target/data/test_data/ ./sf1
Import data
cd nebula-bench
# Modify .evn
cp env .env
vi .env
The following is the example of .env
DATA_FOLDER=sf1
NEBULA_SPACE=sf1
NEBULA_USER=root
NEBULA_PASSWORD=nebula
NEBULA_ADDRESS=192.168.8.61:9669,192.168.8.62:9669,192.168.8.63:9669
#NEBULA_MAX_CONNECTION=100
INFLUXDB_URL=http://192.168.8.60:8086/k6
# Compile nebula-importer and K6
./scripts/setup.sh

# Import data
python3 run.py nebula importer
During the import process, you can focus on the following network bandwidth and disk IO writing.

Execute the load testing
python3 run.py stress run
According to the code source in the file scenarios, the js file will be automatically rendered and K6 will be used to test all scenarios.
After the execution is over, the js file and the result will be saved in the output folder.
Among them, latency is the latency time returned by the server, and responseTime is the time from initiating execute to response by the client. The measurement unit is μs.
[vesoft@qa-60 nebula-bench]$ more output/result_Go1Step.json
{
    "metrics": {
        "data_sent": {
            "count": 0,
            "rate": 0
        },
        "checks": {
            "passes": 1667632,
            "fails": 0,
            "value": 1
        },
        "data_received": {
            "count": 0,
            "rate": 0
        },
        "iteration_duration": {
            "min": 0.610039,
            "avg": 3.589942336582023,
            "med": 2.9560145,
            "max": 1004.232905,
            "p(90)": 6.351617299999998,
            "p(95)": 7.997563949999995,
            "p(99)": 12.121579809999997
        },
        "latency": {
            "min": 308,
            "avg": 2266.528722763775,
            "med": 1867,
            "p(90)": 3980,
            "p(95)": 5060,
            "p(99)": 7999
        },
        "responseTime": {
            "max": 94030,
            "p(90)": 6177,
            "p(95)": 7778,
            "p(99)": 11616,
            "min": 502,
            "avg": 3437.376111156418,
            "med": 2831
        },
        "iterations": {
            "count": 1667632,
            "rate": 27331.94978169588
        },
        "vus": {
            "max": 100,
            "value": 100,
            "min": 0
[vesoft@qa-60 nebula-bench]$ head -300 output/output_Go1Step.csv | grep -v USE
timestamp,nGQL,latency,responseTime,isSucceed,rows,errorMsg
1628147822,GO 1 STEP FROM 4398046516514 OVER KNOWS,1217,1536,true,1,
1628147822,GO 1 STEP FROM 2199023262994 OVER KNOWS,1388,1829,true,94,
1628147822,GO 1 STEP FROM 1129 OVER KNOWS,1488,2875,true,14,
1628147822,GO 1 STEP FROM 6597069771578 OVER KNOWS,1139,1647,true,30,
1628147822,GO 1 STEP FROM 2199023261211 OVER KNOWS,1399,2096,true,6,
1628147822,GO 1 STEP FROM 2199023256684 OVER KNOWS,1377,2202,true,4,
1628147822,GO 1 STEP FROM 4398046515995 OVER KNOWS,1487,2017,true,39,
1628147822,GO 1 STEP FROM 10995116278700 OVER KNOWS,837,1381,true,3,
1628147822,GO 1 STEP FROM 933 OVER KNOWS,1130,3422,true,5,
1628147822,GO 1 STEP FROM 6597069771971 OVER KNOWS,1022,2292,true,60,
1628147822,GO 1 STEP FROM 10995116279952 OVER KNOWS,1221,1758,true,3,
1628147822,GO 1 STEP FROM 8796093031179 OVER KNOWS,1252,1811,true,13,
1628147822,GO 1 STEP FROM 10995116279792 OVER KNOWS,1115,1858,true,6,
1628147822,GO 1 STEP FROM 6597069777326 OVER KNOWS,1223,2016,true,4,
1628147822,GO 1 STEP FROM 8796093028089 OVER KNOWS,1361,2054,true,13,
1628147822,GO 1 STEP FROM 6597069777454 OVER KNOWS,1219,2116,true,2,
1628147822,GO 1 STEP FROM 13194139536109 OVER KNOWS,1027,1604,true,2,
1628147822,GO 1 STEP FROM 10027 OVER KNOWS,2212,3016,true,83,
1628147822,GO 1 STEP FROM 13194139544176 OVER KNOWS,855,1478,true,29,
1628147822,GO 1 STEP FROM 10995116280047 OVER KNOWS,1874,2211,true,12,
1628147822,GO 1 STEP FROM 15393162797860 OVER KNOWS,714,1684,true,5,
1628147822,GO 1 STEP FROM 6597069770517 OVER KNOWS,2295,3056,true,7,
1628147822,GO 1 STEP FROM 17592186050570 OVER KNOWS,768,1630,true,26,
1628147822,GO 1 STEP FROM 8853 OVER KNOWS,2773,3509,true,14,
1628147822,GO 1 STEP FROM 19791209307908 OVER KNOWS,1022,1556,true,6,
1628147822,GO 1 STEP FROM 13194139544258 OVER KNOWS,1542,2309,true,91,
1628147822,GO 1 STEP FROM 10995116285325 OVER KNOWS,1901,2556,true,0,
1628147822,GO 1 STEP FROM 6597069774931 OVER KNOWS,2040,3291,true,152,
1628147822,GO 1 STEP FROM 8796093025056 OVER KNOWS,2007,2728,true,29,
1628147822,GO 1 STEP FROM 21990232560726 OVER KNOWS,1639,2364,true,9,
1628147822,GO 1 STEP FROM 8796093030318 OVER KNOWS,2145,2851,true,6,
1628147822,GO 1 STEP FROM 21990232556027 OVER KNOWS,1784,2554,true,5,
1628147822,GO 1 STEP FROM 15393162796879 OVER KNOWS,2621,3184,true,71,
1628147822,GO 1 STEP FROM 17592186051113 OVER KNOWS,2052,2990,true,5,
It is also possible to execute the load testing in one scenario and continuously adjust the configuration parameters for comparison.
Concurrent reading
#Run Go2Step with 50 virtual users and 300 seconds of duration
python3 run.py stress run -scenario go.Go2Step -vu 50 -d 300
INFO[0302] 2021/08/06 03:55:27 [INFO] finish init the pool

     ✓ IsSucceed

     █ setup

     █ teardown

     checks...............: 100.00% ✓ 1559930     ✗ 0
     data_received........: 0 B     0 B/s
     data_sent............: 0 B     0 B/s
     iteration_duration...: min=687.47µs avg=9.6ms       med=8.04ms max=1.03s  p(90)=18.41ms p(95)=22.58ms p(99)=31.87ms
     iterations...........: 1559930 5181.432199/s
     latency..............: min=398      avg=6847.850345 med=5736   max=222542 p(90)=13046   p(95)=16217   p(99)=23448
     responseTime.........: min=603      avg=9460.857877 med=7904   max=226992 p(90)=18262   p(95)=22429   p(99)=31726.71
     vus..................: 50      min=0         max=50
     vus_max..............: 50      min=50        max=50
Every metric can be monitored at the same time.

checks is to verify whether the request is executed successfully. If the execution fails, the failed message will be saved in the CSV file.
awk -F ',' '{print $NF}' output/output_Go2Step.csv|sort |uniq -c
# Execute Go2Step with 200 virtual users and 300 seconds of duration
python3 run.py stress run -scenario go.Go2Step -vu 200 -d 300
INFO[0302] 2021/08/06 04:02:34 [INFO] finish init the pool

     ✓ IsSucceed

     █ setup

     █ teardown

     checks...............: 100.00% ✓ 1866850    ✗ 0
     data_received........: 0 B     0 B/s
     data_sent............: 0 B     0 B/s
     iteration_duration...: min=724.77µs avg=32.12ms      med=25.56ms max=1.03s  p(90)=63.07ms p(95)=84.52ms  p(99)=123.92ms
     iterations...........: 1866850 6200.23481/s
     latency..............: min=395      avg=25280.893558 med=20411   max=312781 p(90)=48673   p(95)=64758    p(99)=97993.53
     responseTime.........: min=627      avg=31970.234329 med=25400   max=340299 p(90)=62907   p(95)=84361.55 p(99)=123750
     vus..................: 200     min=0        max=200
     vus_max..............: 200     min=200      max=200
K6 metrics to be monitored with Grafana

Concurrent writing
#Execute insert with 200 virtual users and 300 seconds of duration. By default, batchSize is 100.

python3 run.py stress run -scenario go.Go2Step -vu 200 -d 300
The js file can be modified manually to adjust batchSize
sed -i 's/batchSize = 100/batchSize = 300/g' output/InsertPersonScenario.js

# Run K6 manually

scripts/k6 run output/InsertPersonScenario.js -u 400 -d 30s --summary-trend-stats "min,avg,med,max,p(90),p(95),p(99)" --summary-export output/result_InsertPersonScenario.json --out influxdb=http://192.168.8.60:8086/k6
If the batchSize is 300 with 400 virtual users, an error will be returned.
INFO[0032] 2021/08/06 04:03:49 [INFO] finish init the pool

     ✗ IsSucceed
      ↳  96% — ✓ 31257 / ✗ 1103

     █ setup

     █ teardown

     checks...............: 96.59% ✓ 31257       ✗ 1103
     data_received........: 0 B    0 B/s
     data_sent............: 0 B    0 B/s
     iteration_duration...: min=12.56ms avg=360.11ms      med=319.12ms max=2.07s   p(90)=590.31ms p(95)=696.69ms p(99)=958.32ms
     iterations...........: 32360  1028.339207/s
     latency..............: min=4642    avg=206931.543016 med=206162   max=915671  p(90)=320397.4 p(95)=355798.7 p(99)=459521.39
     responseTime.........: min=6272    avg=250383.122188 med=239297.5 max=1497159 p(90)=384190.5 p(95)=443439.6 p(99)=631460.92
     vus..................: 400    min=0         max=400
     vus_max..............: 400    min=400       max=400
awk -F ',' '{print $NF}' output/output_InsertPersonScenario.csv|sort |uniq -c
 31660
   1103  error: E_CONSENSUS_ERROR(-16)."
      1 errorMsg
If E_CONSENSUS_ERROR occurs, it should be that the appendlog buffer of raft is overflown when the concurrency is large, which can be solved by adjusting relevant parameters.
Summary
The load testing uses the LDBC dataset standard to ensure data uniform. Even when bigger data volume, say one billion vertices, is generated, the graph schema is the same.
K6 is more convenient than Jmeter for the load testing. For more details, please refer https://k6.io/docs/.
You can easily find the bottleneck of the system resources by simulating various scenarios or adjust parameters in Nebula Graph with the mentioned tools.


Top comments (1)
Nice write-up.
Regarding the load tests tool, I suggest considering NBomber, a .NET tool for load testing. It's a modern and flexible .NET load-testing framework for Pull and Push scenarios, designed to test any system regardless of a protocol (HTTP/WebSockets/AMQP, etc) or a semantic model (Pull/Push).