For the last year I have been building an internal webapp that allows our remote team members to record results of their work and generate PDF reports for our clients. This app is targeted towards a compliance minded industry and therefore requires a high degree of accuracy. This is not a financial institution or healthcare so audit trails and monitoring logs are not required but we rarely perform hard deletes. That being said there is one circumstance where we prefer a hard delete, when a team member adds a component by mistake but before they have performed any action on that component. I created a scope just for this called untested
class Component < ApplicationRecord
    has_many :test_records, as: :testable
    scope :untested, -> {
       left_outer_joins(:test_records).
       where(test_records: { testable_id: nil } )
    }
end
Ignore that this is a polymorphic association and focus on the fact that we are joining all test_records in the database to their components and then selecting only the records that do not have a testable_id, ensuring that we collect only those components without a test_record. This is a pretty expensive request but it should only occur when we are looking to delete a component. At the time of this story there were 53,000 untested components in the database.
Here is where the problem comes in. In my Cancancan abilities.rb file I added the following line for all of our field personnel:
def certified:
    can :destroy,
        Component, id: Component.untested.map{ |comp| comp.id }
end
Looking at the Cancancan documentation this is not the way to do this. Why was I calling .map here and not just using the scope? Why would I even need to collect all the id’s like this?. Why didn’t I identify this earlier?
The :admin role of course has only one rule that I defined, can :manage, :all. While I was sitting in an ivory tower of administrative privilege my users were suffering from an unnecessary database request on every single call to can?.
When I would log in to the application, I would see 200-500ms response times with the occasional spike to 2000ms. I just thought that this was how the app worked, that there were delays that could not be anticipated due to latency. Upon reflection I think that this was a way to hope the problem away instead of admitting that there was something wrong that needed to be found and fixed.
Once my logs started kicking in though I was seeing 1000ms-2000ms response times for all of my technicians in the field. Over a few months that response time had grown to 5000ms with an occasional timeout. I thought that the PDF generation was the culprit, so I rewrote the entire controller making queries as efficient as possible. And yet, the problem persisted.
Finally, I had a breakthrough when I was reviewing a technician event in the log and noticed the difference between the request that I was making and the request that they were making. Both queries selected from the user and the roles tables, but the technician request was performing a query on the components table that was not being called when I performed the same request
User Load (0.7ms) SELECT "users".* FROM "users" WHERE "users"."id" = $1 ORDER BY "users"."id" ASC LIMIT $2 [["id", xx], ["LIMIT", 1]]
Role Load (0.6ms) SELECT "roles".* FROM "roles" WHERE "roles"."user_id" = $1 LIMIT $2 [["user_id", xx], ["LIMIT", 1]]
Component Load (280.9ms) SELECT "components".* FROM "components" LEFT OUTER JOIN "test_records" ON "test_records"."testable_id" = "components"."id" AND "test_records"."testable_type" = $1 WHERE "test_records"."testable_id" IS NULL [["testable_type", "Component"]]
After spending an embarrassing amount of time trying to locate where this query was coming from and procedurally stepping through the code I finally noticed that the query was happening right after the query to the roles table but before any of the queries generated by the components table. The only place that code was being executed between those queries was the abilities table, and sure enough the earlier code was found.
I immediately changed my destroy method on the components controller to verify that there were 0 test_records and to respond with an error if the device could not be deleted. I removed the offending code from my abilities.rb file and response times immediately dropped to under 500ms. The users rejoiced.

Things I did not know:
Thousands of ‘sql_error_code = 28000 FATAL: no pg_hba.conf entry for host ip_address, user "postgres", database "postgres", SSL off’ were a symptom of my bad code.
Constant Dyno Load is a sign that bad things are happening
A large memory footprint is not “inevitable” with Rails
What the monitoring tools on Heroku should even look like.

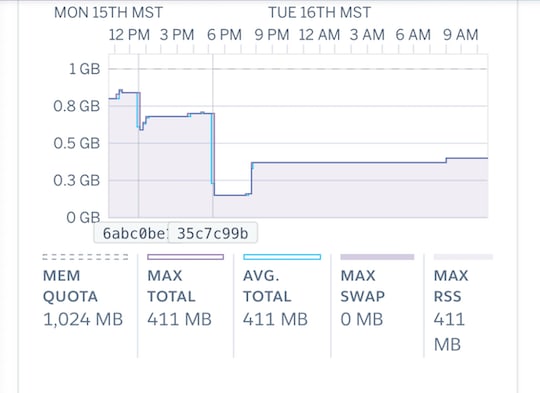
I have been using Heroku at the hobby basic and developer level for years and the logs and analytics have never been available to me. I had no idea how my app should be performing and I am sure that I look a bit foolish to many of you out there but honestly it took 30 sec. timeouts for me to recognize that I was having a real crisis. If your Heroku metrics look like mine did you should know… It’s not supposed to look like that.

Top comments (1)
Thanks for this honest story. It truly is the only way to get better.