A few months back, our web server crashed. It only lasted a minute before restarting, but as the tech guy in a small startup, it was a pretty stressful minute. I never set up a service to restart when memory got low, but we did have some reporting tools connected, so after the crash, I dug into our logs.

Yep, that's a memory leak alright! But how could I track it down?
Just like LEGOs
When debugging, I like to think about memory like LEGOs. Every object created is a brick. Every object type, a different color. The heap is a living room floor and I (the Garbage Collector) clean up the bricks no one is playing with because if I don't, the floor would be a minefield of painful foot hazards. The trick is figuring out which ones aren't being used.
Debugging
When it comes to triaging memory leaks in Node, there are 2 strategies: snapshots and profiles.
A snapshot (AKA heap dump) records everything on the heap at that moment.
It's like taking a photograph of your living room floor, LEGOs and all. If you take 2 snapshots, then it's like a Highlights magazine: find the differences between the 2 pictures and you've found the bug. Easy!
For this reason, snapshots are the gold standard when it comes to finding memory leaks. Unfortunately, taking a snapshot can last up to a minute. During that time, the server will be completely unresponsive, which means you'll want to do it when no one is visiting your site. Since we're an enterprise SaaS, that means Saturday at 3AM. If you don't have that luxury, you'll need to have your reverse proxy redirect to a backup server while you dump.
A sampling allocation profile is the lightweight alternative, taking less than a second. Just as the name implies, it takes a sample of all the objects getting allocated. While this produces a very easy-on-the-eyes flamechart akin to a CPU profile, it doesn't tell you what's being garbage collected.

It's like looking at the LEGOs being played with, but not looking at which ones are being put down. If you see 100 red bricks and 5 blue bricks, there's a good chance the red bricks could be the culprit. Then again, it's equally likely all 100 red bricks are being garbage collected and it's just the 5 blues that are sticking around. In other words, you'll need both a profile and deep knowledge of your app to find the leak.
The Implementation
In my case, I did both. To set up the profiler, I ran it every hour & if the actual memory used had increased by 50MB, it wrote a snapshot.
import * as heapProfile from 'heap-profile'

let highWaterMark = 0
heapProfile.start()
  setInterval(() => {
    const memoryUsage = process.memoryUsage()
    const {rss} = memoryUsage
    const MB = 2 ** 20
    const usedMB = Math.floor(rss / MB)
    if (usedMB > highWaterMark + 50) {
      highWaterMark = usedMB
      const fileName = `sample_${Date.now()}_${usedMB}.heapprofile`
      heapProfile.write(fileName)
    }
  }, 1000 * 60 * 60)
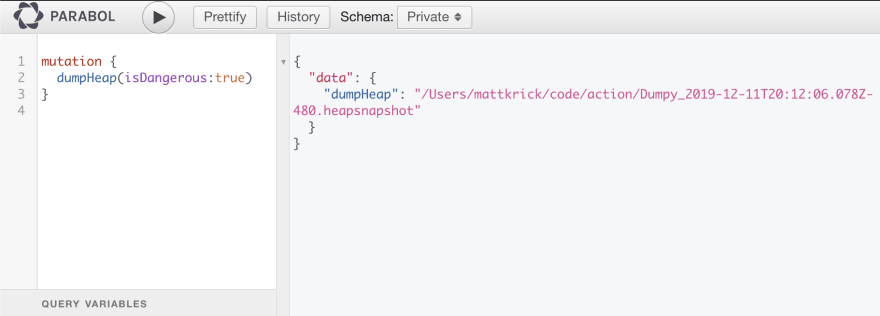
The snapshot was a little more interesting. While a normal approach is to send a SIGUSR2 signal to the node process using kill, I don't like that because you know what else can send a SIGUSR2? Anything. You may have a package in your dependencies right now (or in the future) that emits that same signal and if it does, then your site is going down until the process completes. Too risky, plus a pain to use. Instead, I created a GraphQL mutation for it. I put it on our "Private" (superuser only) schema and can call it using GraphiQL.

The code behind the endpoint is dead simple:
import profiler from 'v8-profiler-next'

const snap = profiler.takeSnapshot()
const transform = snap.export()
const now = new Date().toJSON()
const fileName = `Dumpy_${now}.heapsnapshot`
transform.pipe(fs.createWriteStream(fileName))
return new Promise((resolve, reject) => {
  transform.on('finish', () => {
    snap.delete()
    resolve(fileName)
  })
})
We take a snapshot, pipe it to a file, delete the snap, and return the file name. Easy enough! Then, we just upload it to Chrome DevTools Memory Tab and away we go.
Reading the Dump
While the profile wasn't very helpful, the heap dump got me exactly what I needed. Let's take a look at a leak called ServerEnvironment.

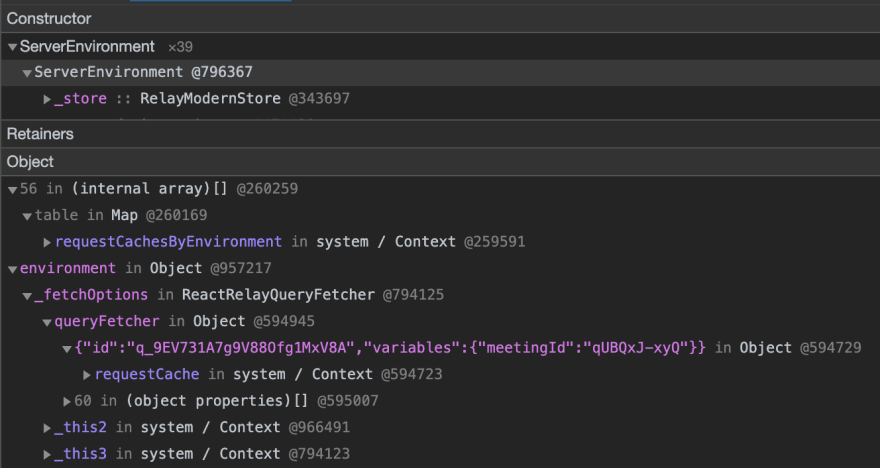
In our app, we do some light server side rendering (SSR) for generating emails. Since our app is powered by Relay (a great GraphQL client cache like Apollo), we use what I named a ServerEnvironment to fetch the data, populate the components, and then go away. So why are there 39 instances? Who's still playing with those LEGOs?!
The answer rests in the Retainers section. In plain English, I read the table like this, "ServerEnvironment can't be garbage collected because it is item 56 in a Map, which can't be garbage collected because it is used by object requestCachesByEnvironment. Additionally, it's being used by environment, which is used by _fetchOptions, which is used by queryFetcher which is used by" ...you get it. So requestCachesByEnvironment and requestCache are the culprits.
If I look for the first one, I find the offender in just a couple lines of code (edited for brevity, original file here):
const requestCachesByEnvironment = new Map();

function getRequestCache(environment) {
  const cached = requestCachesByEnvironment.get(environment)
  if (!cached) {
    const requestCache = new Map()
    requestCachesByEnvironment.set(environment, requestCache)
  }
  return requestCachesByEnvironment.get(environment)
}
This is your classic memory leak. It's an object at the outermost closure of a file that's being written to by a function in an inner closure & no delete call to be found. As a general rule of thumb, writing to variables in outer closures are fine because there's a limit, but writing to objects often leads to problems like this since the potential is unbounded. Since the object isn't exported, we know we have to patch this file. To fix, we could write a cleanup function, or we can ask ourselves 2 questions:
1) Is that Map being iterated over? No
2) If the Map item is removed from the rest of the app does it need to exist in the Map? No
Since the answer to both questions is No, it's an easy fix! Just turn Map into WeakMap and we're set! WeakMaps are like Maps, except they let their keys get garbage collected. Pretty useful!
The second retainer can be tracked down to requestCache. Instead of a Map, this is a plain old JavaScript object, again kept in the outermost closure (notice a pattern here? it's a bad pattern). While it'd be great to achieve this in a single closure, that'd require a big rewrite. A shorter, elegant solution is to wipe it if it's not running in the browser, seen here.
With those 2 fixes, our ServerEnvironment is free to be garbage collected and the memory leak is gone! All that's left to do is make the fixes upstream and use the new version. Unfortunately, that can take weeks/months/never happen. For immediate gratification, I like to use the FANTASTIC gitpkg CLI that publishes a piece of a monorepo to a specific git tag of your fork. I never see folks write about it, but it has saved me so much time forking packages I had to share.
Memory leaks happen to everyone. Please note that I'm not picking on code written by Facebook to be rude, insult, or take some weird political stance against their company ethics. It's simply because 1) These are memory leaks I found in my app 2) they are textbook examples of the most common kind of leaks and 3) Facebook is kind enough to open source their tooling for all to improve.
Speaking of open source, if you'd like to spend your time writing open source code from anywhere in the world (👋 from Costa Rica) come join us! We're a bunch of ex-corporate folks on a mission to end pointless meetings & make work meaningful. Check us out at https://www.parabol.co/join or message me directly.


Top comments (1)
Great write up! Thanks for sharing your investigation!!