In this post, we will be creating a simple scalable dashboard that updates in real-time using React, GraphQL Subscriptions, and Redis PubSub. Real-time dashboards are used for monitoring infrastructure (servers, network, services), application traffic (transaction volume, number of users), alerts (application health, notify of critical issues, downtimes) etc. In most cases, dashboards are driven by one or more datasources.
Developers utilize a few open-source applications to create rich and useful dashboards. For example, Kibana is used for visualizing application logs integrated with ELK Stack. Grafana provides the platform for building variety of visualizations on top of time series databases such as Prometheus, Graphite, and OpenTSDB. But, as of today, they support only pull-based model. That is, when a user opens the browser, the application queries the datasource to render the dashboard. It is the most widely used model as compared to a Push model.
When push-model can be used?
Assume you have a dashboard consisting of 20 panels; querying data from multiple datasources in real-time. The User has set a refresh rate of 5 seconds. If, on an average 100 users open the dashboard at any given time results in 20 x 100 = 2000 requests every 5 seconds! This is manageable if you have good infrastructure for your underlying time-series database. Otherwise multiple heavy queries can pile-up the memory causing delay in retrieving result. This problem can be solved either by introducing an intelligent caching solution, or a simple push-model using WebSockets. It is useful (and simple), for the situation where multiple users are querying for the same data, at the same or slightly-different time.
Here's a minimal flow of how push-model can work:
- A Connection is established between server and client using WebSocket.
- Server sends the required data to client at regular intervals
- If the connection breaks, the client can retry (even indefinitely).
- At any given point of time, all clients display the same data
What are we building?
Here's the preview of a simple real-time dashboard we will be building. It contains 4 panels - CPU Utilization, Traffic information, Data-center distribution, and alerts.

GraphQL Subscriptions
GraphQL is a query language for APIs and a runtime for fulfilling those queries with your existing data. Check out graphql.org for more info if you are not familiar with GraphQL.
Along with queries and mutations, GraphQL introduced another specification - Subscriptions.
just as the list of mutations that the server supports describes all of the actions that a client can take, the list of subscriptions that the server supports describes all of the events that it can subscribe to. Just as a client can tell the server what data to refetch after it performs a mutation with a GraphQL selection, the client can tell the server what data it wants to be pushed with the subscription with a GraphQL selection. - GraphQL blog
For example, the client can subscribe for CPU data using the following subscription syntax
subscription CPU {
  cpu {
    percentage
  }
}
Server can publish data at regular intervals,
pubsub.publish(CPU, { cpu: { percentage: 65 } });
Redis PubSub
Since version 2.0, Redis supports Publish-Subscribe pattern using commands PUBLISH, SUBSCRIBE and UNSUBSCRIBE. Read more about it from Redis Documentation.
Messages can be published via channels. To send the message "hello listeners" via channel myradio - use the PUBLISH command
PUBLISH myradio "hello listeners"
But, a channel is useless with nobody to listen! Open another tab with redis-cli and subscribe to the channel myradio.
SUBSCRIBE myradio
Now, send the publish command again and watch the other terminal.

Combining GraphQL subscription & Redis PubSub
GraphQL subscription specification can be implemented using Apollo's package - graphql-subscriptions.
Using Redis as a mediator for publishing events from client to server enables horizontal scaling. The package graphql-redis-subscriptions can be plugged as a PubSubEngine interface to graphql-subscriptions.
Sample Implementation
For full implementation - see github.com/nowke/realtime-dashboard-demo/.
 nowke
/
realtime-dashboard-demo
nowke
/
realtime-dashboard-demo
A lightweight scalable real-time dashboard using React, GraphQL subscriptions and Redis PubSub
A lightweight real-time dashboard using React, GraphQL subscriptions and Redis PubSub
Walkthrough: https://dev.to/nowke/building-real-time-dashboard-using-react-graphql-subscriptions-and-redis-pubsub-2gip
Preview
Setup
Prerequisites
- Install NodeJS (LTS)
- Install Redis (Server and Client)
- MacOS -
brew install redis
- MacOS -
- Install Yarn
- MacOS -
brew install yarn
- MacOS -
Clone the repository
git clone https://github.com/nowke/realtime-dashboard-demo.git
(a) Setup server
Install dependencies
cd server
yarn
Start the server
yarn start
Server will be running at http://localhost:4000/. The below UI will be rendered
(b) Setup worker
Start Redis server
redis-server
Install dependencies
cd worker
yarn
Start the worker
yarn start
The following logs will be printed,
Starting worker
Scheduled Jobs for CPU, Traffic, distribution, messages
Fetched new results for MESSAGES
Fetched new results for CPU
Fetched new results for DISTRIBUTION
Fetched new results for CPU
Fetched new results for MESSAGES
Fetched new results for TRAFFIC
(c) Setup client
Install dependencies
cd client
yarn
Start client
yarn start
Client will be running at http://localhost:3000…
The sample code consists of 3 components,
- Server
- Client - user's browser, connects to the server
- Worker - mocks real events by publishing events to the server
Server
Install the required pacakges
yarn add graphql apollo-server graphql-redis-subscriptions graphql-subscriptions ioredis moment
Make sure redis-server running in localhost at PORT 6379 and setup the PubSub using graphql-redis-subscriptions. It is used for publishing messages.
const { RedisPubSub } = require("graphql-redis-subscriptions");

const pubsub = new RedisPubSub();
module.exports = pubsub;
Define the GraphQL schema.
- Query - for getting the initial result from Redis.
- Mutation - for publishing new messages.
- Subscription - for data exchange in real-time between client and server.
const { gql } = require("apollo-server");

const schema = gql`
  type Dps {
    timestamp: Int!
    value: Float!
  }

  type Traffic {
    total: Int!
    dps: [Dps]
  }

  type CPU {
    percentage: Float!
  }

  type Distribution {
    region: String!
    percentage: Float!
  }

  type Message {
    title: String!
    description: String!
    color: String!
  }

  type Query {
    cpu: CPU
    traffic: Traffic
    distribution: [Distribution]
    messages: [Message]
  }

  type Mutation {
    cpu: CPU
    traffic: Traffic
    distribution: [Distribution]
    messages: [Message]
  }

  type Subscription {
    cpu: CPU
    traffic: Traffic
    distribution: [Distribution]
    messages: [Message]
  }
`;

module.exports = schema;
The helper functions are provided to generate dummy data for all 4 panels - refer server/utils/generator.js. Using these data generators, write a wrapper function publishRandomData.
const pubsub = require("./pubsub");
const { set } = require("./utils/redis");

const COMPONENTS = {
  CPU: "cpu",
  TRAFFIC: "traffic",
  DISTRIBUTION: "distribution",
  MESSAGES: "messages"
};

const publishRandomData = async (generator, component) => {
  const data = generator();
  pubsub.publish(component, { [component]: data });
  await set(component, data);
  return data;
};
The function publishRandomData can be called for CPU usage as below.
const getCPU = () => 50;
await publishRandomData(getCPU, "CPU")
Define the resolver functions for the previously defined schemas (sample given below for CPU)
const { get } = require("./utils/redis");

module.exports = {
  Query: {
    cpu: () => get(COMPONENTS.CPU)
  },
  Mutation: {
    cpu: () => publishRandomData(cpuData, COMPONENTS.CPU),
  },
  Subscription: {
    cpu: {
      subscribe: () => pubsub.asyncIterator(COMPONENTS.CPU)
    },
  }
}
Start the server
const { ApolloServer } = require("apollo-server");

const typeDefs = require("./schema");
const resolvers = require("./resolvers");

// Server
const server = new ApolloServer({ typeDefs, resolvers });

server.listen().then(({ url }) => {
  console.log(`🚀  Server ready at ${url}`);
});
$ yarn start
yarn run v1.13.0
$ nodemon index.js
...
🚀  Server ready at http://localhost:4000/
Go to localhost:4000 to open the GraphQL playground.
Subscribe to CPU percentage in Tab 1 and hit the play button
subscription {
  cpu {
    percentage
  }
}
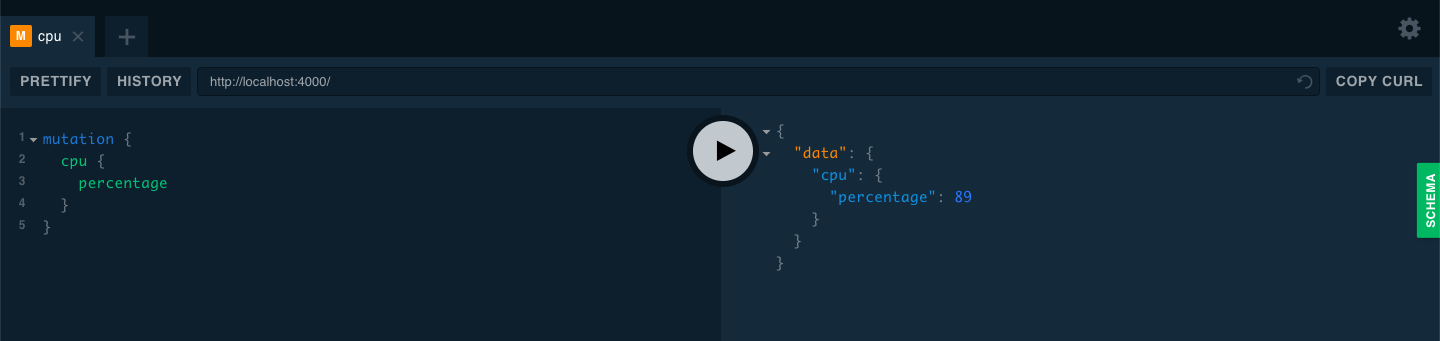
Run the mutation for CPU in Tab 2 for publishing a random percentage value. The same will be received as an event in Tab 1. Try the mutation multiple times to receive different values.
mutation {
  cpu {
    percentage
  }
}
Run the query for CPU in Tab 3. The last published value is returned - this is because the recent value is cached in Redis.
query {
  cpu {
    percentage
  }
}
{
  "data": {
    "cpu": {
      "percentage": 25
    }
  }
}
Client
Create a new React application using create-react-app for client
yarn create react-app client
Install the required dependencies.
yarn add apollo-boost apollo-client apollo-link-ws graphql react-apollo subscriptions-transport-ws
Setup Apollo HTTP client and websocket client, since both types of connection are required. HTTP server will be running at http://localhost:4000 and websocket subscription server at ws://localhost:4000/graphql.
import React, { Component } from "react";
import { ApolloClient } from "apollo-client";
import { InMemoryCache } from "apollo-cache-inmemory";
import { ApolloProvider } from "react-apollo";
import { split } from "apollo-link";
import { HttpLink } from "apollo-link-http";
import { WebSocketLink } from "apollo-link-ws";
import { getMainDefinition } from "apollo-utilities";

import './App.css'
import Home from "./Pages/Home";

// Create an http link:
const httpLink = new HttpLink({
  uri: "http://localhost:4000"
});

// Create a WebSocket link:
const wsLink = new WebSocketLink({
  uri: `ws://localhost:4000/graphql`,
  options: {
    reconnect: true
  }
});

// using the ability to split links, you can send data to each link
// depending on what kind of operation is being sent
const link = split(
  // split based on operation type
  ({ query }) => {
    const { kind, operation } = getMainDefinition(query);
    return kind === "OperationDefinition" && operation === "subscription";
  },
  wsLink,
  httpLink
);

const client = new ApolloClient({
  link,
  cache: new InMemoryCache()
});

class App extends Component {
  render() {
    return (
      <ApolloProvider client={client}>
        <Home />
      </ApolloProvider>
    );
  }
}

export default App;
The Home component is wrapped with ApolloProvider, which enables running queries and subscriptions.
Let us design CPU usage component - CpuUsage.js.
Define the query and subscription
import gql from "graphql-tag";

const QUERY = gql`
  query CPU {
    cpu {
      percentage
    }
  }
`;

const SUBSCRIPTION = gql`
  subscription CPU {
    cpu {
      percentage
    }
  }
`;
The requirement is as follows.
- On initial load, data should be rendered via
query(from Redis Key-value store) - Post load, component should render the value from subscription (from Redis PubSub channel)
This can be achieved using subscribeToMore prop given by Query component in react-apollo - https://www.apollographql.com/docs/react/advanced/subscriptions.html#subscribe-to-more
import React, { Component } from "react";
import { Query } from "react-apollo";

const CpuUsageContainer = () => (
  <Query query={QUERY}>
    {({ subscribeToMore, ...result }) => (
      <CpuUsage
        {...result}
        subscribeToNewData={() =>
          subscribeToMore({
            document: SUBSCRIPTION,
            updateQuery: (prev, { subscriptionData }) => {
              if (!subscriptionData.data) return prev;
              return subscriptionData.data;
            }
          })
        }
      />
    )}
  </Query>
)
Display CPU percentage in the CpuUsage component.
class CpuUsage extends Component {
  componentDidMount() {
    this.props.subscribeToNewData();
  }

  render() {
    const { data, error, loading } = this.props;
    if (loading) return <p> Loading ... </p>;
    if (error) return <p>Error!</p>;
    return (
      <p> CPU Usage: {data.cpu.percentage}% </p>
    )
  }
}
Refer the file CpuUsage.js for complete class definition with Pie chart

Worker
Real events can be mocked using a simple scheduler script by calling mutation for the 4 panels at regular intervals. The package node-schedule can be used for creating asynchronous schedulers.
Install the dependencies
yarn add node-schedule request request-promise
Define the mutations for each panels
const queries = {
  CPU: `
    mutation {
      cpu {
        percentage
      }
    }
    `,
  TRAFFIC: `
    mutation {
      traffic {
        total
        dps {
          timestamp
          value
        }
      }
    }
    `,
  DISTRIBUTION: `
    mutation {
      distribution {
        region
        percentage
      }
    }
    `,
  MESSAGES: `
    mutation {
      messages {
        title
        description
        color
      }
    }
    `
};
For example, add a scheduler for CPU using schedule.scheduleJob for every 3 seconds
const schedule = require("node-schedule");

schedule.scheduleJob("*/3 * * * * *", async () => {
  await makeHttpRequest("CPU"); // Call mutation for CPU panel
  console.log("Fetched new results for CPU");
});
Refer worker/worker.js for complete script
Run the worker
$ yarn start
yarn run v1.13.0
$ node worker.js
Starting worker
Scheduled Jobs for CPU, Traffic, distribution, messages
Fetched new results for TRAFFIC
Fetched new results for MESSAGES
Fetched new results for CPU
Fetched new results for DISTRIBUTION
Fetched new results for CPU
Fetched new results for MESSAGES
Fetched new results for TRAFFIC
...
...
Scaling
For high-availability, server program would be deployed in multiple instances connected using a Load-balancer.
Consider 4 servers S1, S2, S3 and S4. When a user opens the browser (client), it can connect to any of the servers via load-balancer. All of these servers are connected to a redis cluster R.
If nginx is used, websocket requests can be routed by changing the configuration. Refer www.nginx.com/blog/websocket-nginx/ for details.
Architecture diagram
The following diagram represents a configuration where 4 clients are connected to 4 servers via load-balancer

Analyzing a request flow from Worker,

- Worker makes a
POSTrequest (i.e. a mutation) to one of the servers (via load balancer), sayS1. -
S1sendsPUBLISHcommand to redis cluster with data forcpu. - Since all servers are subscribed to same channel in redis, all of them (
S1,S2,S3andS4) receive data forcpu. - Servers publish the data via websocket to all the clients (
C1,C2,C3,C4).


Top comments (2)
I am currently working on my thesis project of which i am responsible for developing a web app for an existing real-time network monitoring system. I am new to web dev and this looks a good project for me to learn. Thanks for all the input!
Really really interesting! I've been working with GraphQL a little, but never with subscriptions!