In my last post, I tackled my first project with OpenTelemetry and built a basic demo to show how to use distributed tracing and the Stackdriver exporter. I chose Go for that exercise because at the time it was the only language that had a Stackdriver exporter for tracing available. This time, I wanted to attempt using OpenTelemetry for metric instrumentation and noticed that opentelemetry-go does not have a Stackdriver exporter for metrics ready yet. I attempted to use the Prometheus exporter instead, but could not figure out how to make it play nice with the Mux router and switched to Node.js instead.
So - here's how I built a basic Hello World Node.js app and instrumented it with OpenTelemetry to expose basic "golden signals" metrics (request count, error count, and latency) to Prometheus.
The app and instrumentation
As always, I've made my code available in a Github repo. Let's review the interesting parts.
Imports and setup
// set up prometheus
const prometheusPort = 8081;
const app = express();
const meter = new MeterRegistry().getMeter('example-prometheus');
const exporter = new PrometheusExporter(
  {
    startServer: true,
    port: prometheusPort
  },
  () => {
    console.log("prometheus scrape endpoint: http://localhost:"
      + prometheusPort
      + "/metrics");
  }
);
meter.addExporter(exporter);
I'm only using three external packages - Express to handle requests and two OpenTelemetry packages - one to write the metrics, and another to export them to Prometheus. Requests to :8081/metrics will be handled by Prometheus.
Note that I've overridden the default port that's set in the Prometheus exporter code.
Metric definition
// define metrics with description and labels
const requestCount = meter.createCounter("request_count", {
  monotonic: true,
  labelKeys: ["metricOrigin"],
  description: "Counts total number of requests"
});
const errorCount = meter.createCounter("error_count", {
    monotonic: true,
    labelKeys: ["metricOrigin"],
    description: "Counts total number of errors"
});
const responseLatency = meter.createGauge("response_latency", {
    monotonic: false,
    labelKeys: ["metricOrigin"],
    description: "Records latency of response"
});
const labels = meter.labels({ metricOrigin: process.env.ENV});
In the next part, I define the three metrics I want to track. Request count and error count are both monotonic counters, meaning that they can only be increased. Response latency is a non-monotonic gauge, since I want to track latency for every request. I am also using a single label because I could not figure how to get metrics to work properly with no labels.
Request handling
app.get('/', (req, res) => {
    // start latency timer
    const requestReceived = new Date().getTime();
    console.log('request made');
    // increment total requests counter
    requestCount.bind(labels).add(1);
    // return an error 1% of the time
    if ((Math.floor(Math.random() * 100)) > 50) {
        // increment error counter
        errorCount.bind(labels).add(1);
        // return error code
        res.status(500).send("error!")
    }
    else {
        // delay for a bit
        sleep(Math.floor(Math.random()*10000));
        // record response latency
        const measuredLatency = new Date().getTime() - requestReceived;
        responseLatency.bind(labels).set(measuredLatency)
        res.status(200).send("success in " + measuredLatency + " ms")
    }
})

app.listen(8080, () => console.log(`Example app listening on port 8080!`))
At this point, the app is ready to accept incoming requests. Requests to :8081/metrics will be handled by Prometheus, and I'm using Express to handle requests to :8080/. For every request, the app creates a timer (measuredLatency) and keeps it running until it's ready to respond. It generates a random number between 0 and 100 and uses it to return an error half the time, in which case latency is not reported. If there's no error to return, the apps sleeps between 1 and 10 seconds, takes another time snapshot, calculates the elapsed time, and returns that value as the latency.
Metrics endpoint
When I run the app locally, I can then hit the /metrics endpoint and see the metrics I've registered there:

Deploying the app
At this point, I was ready to run the app and generate actual traffic to it. That required:
- creating a GKE cluster
- installing Prometheus on it
- deploying the app and configure the
/metricsendpoint to be scraped
Let's dive in!
Creating the cluster
I took a very straightforward approach and used the Cloud Console to create a single-node cluster (that turned out to be the wrong choice) using an n1-standard node. I then used gcloud container clusters get-credentials <cluster> --zone=<zone> to get credentials for it to be able to access it from my local workstaton.
$ kubectl get nodes
NAME                                     STATUS   ROLES    AGE     VERSION
gke-small-cluster-pool-1-b40da891-fc1p   Ready    <none>   7h27m   v1.15.7-gke.23
Installing Prometheus
I took the simple option here:
$ brew install helm # install helm, the package manager for Kubernetes
$ helm repo add stable https://kubernetes-charts.storage.googleapis.com/
$ helm repo update
$ helm install prometheus stable/prometheus
That was enough to get Prometheus up and running, but I had to increase the size of my cluster to get enough CPU to run everything.
> kubectl get pods
NAME                                            READY   STATUS    RESTARTS   AGE
prometheus-alertmanager-77995478d8-lh4c5        2/2     Running   0          6m34s
prometheus-kube-state-metrics-f96cbbf97-vc56g   1/1     Running   0          6m34s
prometheus-node-exporter-8xlwp                  1/1     Running   0          114s
prometheus-node-exporter-s2pnt                  1/1     Running   0          6m34s
prometheus-node-exporter-xbtrs                  1/1     Running   0          112s
prometheus-pushgateway-747dc5fb57-rw72p         1/1     Running   0          6m34s
prometheus-server-6f7467bfdd-5vfgx              2/2     Running   0          6m34s
I verified that Prometheus was working by using port-forward:

Deploying the app
I created a simple Dockerfile:
FROM node:10

# Create app directory
WORKDIR /usr/src/app

# Install app dependencies
COPY package*.json ./
RUN npm install

# Bundle app source
COPY . .

EXPOSE 8080 8081
CMD [ "node", "app.js" ]
I built the image using gcloud builds submit and created a deployment file:
apiVersion: apps/v1
kind: Deployment
metadata:
  name: ot-metrics-deployment
  labels:
    app: opentelemetry
spec:
  replicas: 1
  selector:
    matchLabels:
      app: opentelemetry
  template:
    metadata:
      annotations:
        prometheus.io/scrape: "true"      # must be quoted
        prometheus.io/port: "8081" # must be quoted
        prometheus.io/path: "/metrics"      # it defaults to /metrics
      labels:
        app: opentelemetry
    spec:
      containers:
      - name: opentelemetry-server
        image: gcr.io/stack-doctor/ot-metrics-demo:latest
        ports:
        - containerPort: 8080
Next, I used kubectl apply -f to create the app and kubectl expose deployment --type=LoadBalancer to make it externally available. Once the external IP address was available, I configured a Stackdriver Uptime Check against it to generate a steady stream of traffic.
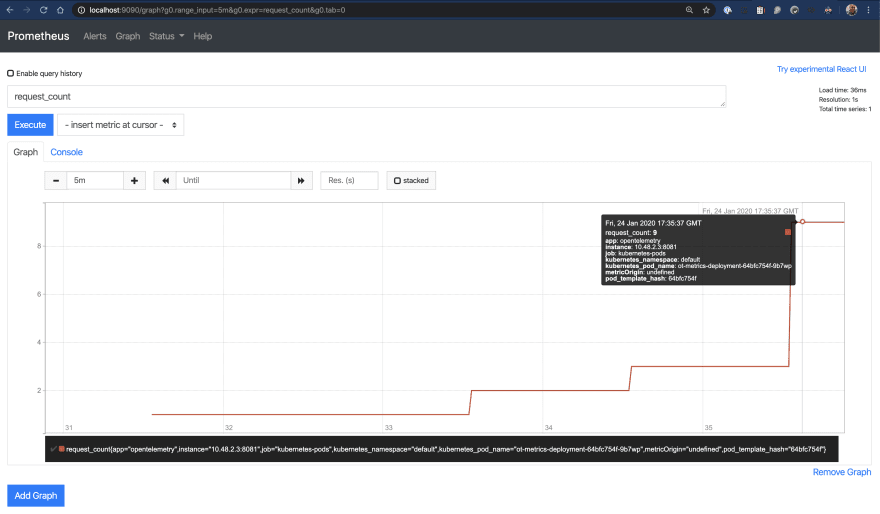
Metrics in Prometheus
At this point, all of the setup was done. I accessed Prometheus again to confirm that the metrics I created using OpenTelemetry were available:
What have I learned?
Data model
In my OpenCensus exercise, I learned about using primitives like Views, Measurements, and Measures. I also learned how to create histograms and control aggregation. My very limited experience with OpenTelemetry has shown that this model seems to be somewhat simpler. In this exercise, I simply defined metrics and set their value when necessary. The exporter took care of the rest. While I probably missed out on a lot of detail, this initial experience makes things seem quite a bit easier to get started with, which is great for folks just getting started with this kind of instrumentation.
Exporters
I've also realized that the project is still in relatively early stages. For example, there are no Stackdriver metric exporters available as I'm writing this. Trace exporters have been written for (at least) Go and Node.js, but metrics are not yet available. As such, Using this on GCP would require me to setup the Prometheus/Stackdriver integration using these instructions
In conclusion...
I greatly enjoyed learning how to use OpenTelemetry to create custom metric telemetry - using it to instrument my app to expose the "golden signals" was quite straightforward, thanks largely to the excellent examples provided in the OpenTelemetry Github repo. Thanks for reading - come back next time when I attempt to use OpenTelemetry to integrate tracing and logs in Stackdriver!

Latest comments (0)