
Written by Yoav Danieli @ Team Aspecto
In this guide, you will learn how to set up a working OpenTelemetry Collector on Kubernetes that is configured to receive data in OTLP format via HTTP or gRPC and send traces for visualization in both Jaeger and Aspecto.
The purpose of this tutorial is to simplify the process by going through the main steps and solving common issues.
Before we start I recommend reading the following blog posts that explain:
To demonstrate how the OpenTelemetry collector can be deployed on a Kubernetes cluster, I will use a similar configuration to that in the second article.
Also, a basic knowledge of Kubernetes could help. I will explain the Kubernetes commands and resources I'm using, but the inner workings of Kubernetes are out of this article's scope.
Next in this series
- OpenTelemetry Collector as an Agent on Kubernetes -- Part 2
- OpenTelemetry Collector on Kubernetes with Helm Chart -- Part 3
OpenTelemetry Collector on Kubernetes: Creating a Development Environment
We will use Minikube Kubernetes runtime in this article. There are many other choices for local development such as Kind, k3s, MicroK8s, and more. Each one has its unique setup, but the configuration files for the cluster are (almost) the same so feel free to play with your preferred runtime.
To set up a Kubernetes cluster we will first need to install:
Kubectl:
brew install kubectl
Then, install minikube:
brew install minikube
To start a cluster run:
minikube start
Minikube automatically configures kubectl to work with the newly created cluster.
A cool feature of minikube is the dashboard feature. By running minikube dashboard in a different terminal, you can open a convenient UI that you can use to examine your local cluster. It is helpful for beginners, but I would recommend relying on this sparingly.
Once you migrate to a cloud environment, you'll still need to rely on the command line.
Run OpenTelemerty Collector as a Gateway in Kubernetes cluster
Kubernetes Resource Configuration
Namespace
Now that we have a cluster running, we can start creating Kubernetes resources. Start by creating a namespace for all of our OpenTelemetry-related work. Although it is not a must, it's best practice to separate logical groups into namespaces.
Create a file named otel-collector-config.yml and add the namespace object:
# otel-collector-config.yml
apiVersion: v1
kind: Namespace
metadata:
 name: opentelemetry
To deploy the configuration to the cluster and create or update resources we use the command:
kubectl apply -f ./otel-collector-config.yml
By running kubectl get namespaces, we can verify that our 'opentelemetry namespace' was indeed created. We can also see namespaces used for the Kubernetes internal workings as well as a default namespace.
ConfigMap
Next, we want to create a ConfigMap resource. To pass the collector a configuration file, we need to store it inside the cluster.
We use a ConfigMap. In the config file, enter three dashes after the namespace --- This lets kubectl know where a new resource ends and another begins.
After that, enter the following ConfigMap resource:
---
apiVersion: v1
kind: ConfigMap
metadata:
 name: otel-collector-conf
 namespace: opentelemetry
 labels:
   app: opentelemetry
   component: otel-collector-conf
data:
 otel-collector-config: |
   receivers:
     otlp:
       protocols:
         grpc:
         http:
   exporters:
     otlp/aspecto:
       endpoint: otelcol.aspecto.io:4317
       headers:
         Authorization: ${ASPECTO_API_KEY}
     jaeger:
       endpoint: localhost:14250
       tls:
         insecure: true
     logging:
   processors:
     Batch:
     resource:
       attributes:
         - key: test.key
           value: "test-value"
           action: insert
   extensions:
     health_check:
     zpages:
       endpoint: :55679
   service:
     telemetry:
       logs:
         level: "debug"
     extensions: [zpages, health_check]
     pipelines:
       traces:
         receivers: [otlp]
         processors: [batch]
         exporters: [logging, jaeger, otlp/aspecto]
Note this is a similar configuration to the one in the article I mentioned at the beginning. But let's go over it quickly to be sure:
- Receivers -- We are defining the receivers to receive data in otlp format in both grpc and http protocols on their default endpoint. Which is the local host and the port 4317 for grpc and 4318 for http.
- Exporters -- We define two exporters. Jaeger and Aspecto. Jaeger is an open-source visualization tool that we will need to set up locally from an image. And Aspecto is a distributed tracing platform, to use Aspecto you will need to create a free account and generate an Aspecto api key (Go to Setting -> Integrations -> Tokens)
- Processors -- We are using a batch processor to send all telemetry data to our exporters in batches. We also use a custom resource to insert a test attribute.
- Extensions -- Defining the health check and zPages extensions. We will use them once we deploy the collector.
- Service -- Enabling the traces pipelines for the receivers, processors, exporters, and extensions we defined above. We also set the collector telemetry log level to be 'debug' so we can see all sorts of fascinating things when we run.
Service
To pass data to the collector, we need a network service. Let's create and open all the relevant ports.
Enter the following Service resource:
---
apiVersion: v1
kind: Service
metadata:
 name: otel-collector
 namespace: opentelemetry
 labels:
   app: opentelemetry
   component: otel-collector
spec:
 ports:
   - name: otlp-grpc # Default endpoint for OpenTelemetry gRPC receiver.
     port: 4317
     protocol: TCP
     targetPort: 4317
   - name: otlp-http # Default endpoint for OpenTelemetry HTTP receiver.
     port: 4318
     protocol: TCP
     targetPort: 4318
   - name: zpages
     port: 55679
     protocol: TCP
     targetPort: 55679
   - name: health-check
     port: 13133
     protocol: TCP
     targetPort: 13133
 selector:
   component: otel-collector
Make sure you open all the ports the collector is using. Otherwise, we will not be able to receive data or communicate with the collector.
Deployment
Because we run the collector as a gateway, we will use a deployment. It will allow us to scale once we encounter an increase in traffic.
Enter the following configuration:
---
apiVersion: apps/v1
kind: Deployment
metadata:
 name: otel-collector
 namespace: opentelemetry
 labels:
   app: opentelemetry
   component: otel-collector
spec:
 selector:
   matchLabels:
     app: opentelemetry
     component: otel-collector
 minReadySeconds: 5
 replicas: 1
 template:
   metadata:
     namespace: opentelemetry
     labels:
       app: opentelemetry
       component: otel-collector
   spec:
     containers:
       - command:
           - '/otelcol'
           - '--config=/conf/otel-collector-config.yaml'
         image: otel/opentelemetry-collector:latest
         name: otel-collector
         resources:
           limits:
             cpu: '1'
             memory: 2Gi
           requests:
             cpu: 200m
             memory: 400Mi
         ports:
           - containerPort: 4317   #otlp grpc
           - containerPort: 4318   # otlp http
           - containerPort: 55679  # zpages
           - containerPort: 13133  # health check
         volumeMounts:
           - name: otel-collector-config-vol
             mountPath: /conf
     volumes:
       - configMap:
           name: otel-collector-conf
           items:
             - key: otel-collector-config
               path: otel-collector-config.yaml
         name: otel-collector-config-vol
In this configuration, we define one container to run the opentelemetry-collector image. It receives a command line argument to run with a configuration file created from our ConfigMap resource.
The configuration file is created in the volumes section of the deployment and in the volumeMounts section inside the container.
We are setting the deployment to have exactly 1 replica and setting the container CPU and memory limits according to the minimum that was checked for performance in their docs.
Deploying the OpenTelemerty Collector Gateway locally
Now that we created our cluster configuration, it's time to apply it to the cluster.
Run:
Kubectl apply -f ./otel-collector-config.yml
Let's check the collector is alive by making a health check call:
curl localhost:13133
We got back the following response:
curl: (7) Failed to connect to localhost port 13133 after 5 ms: Connection refused
- Issue #1 -- Specifying the right type of service: This is not a problem with the collector. This is because we forgot to specify to our service that we need these ports exposed outside of the cluster. This means we need a service of the type LoadBalancer. Let's add
' type: LoadBalancer'inside the service spec block.
Calling the health check again still brings the same result.
- Issue #2 -- Opening minikube tunnel: In minikube, in order to communicate with our load balancer, we need to run the command 'minikube tunnel' in a different terminal. This tunnel needs to stay open as long as our cluster runs.
Calling the health check once more gives us the following response:
{
"status":"Server available", "upSince":"2022-10-08T04:55:17.253942835Z", "uptime":"2h19m34.104112936s"
}
Now let's start generating some traces for testing.
I created a simple Typescript program that sends a span every 5 seconds to a collector's endpoint using an otlp-http exporter.
import { trace } from '@opentelemetry/api';
import * as opentelemetry from '@opentelemetry/sdk-node';
import { SimpleSpanProcessor } from '@opentelemetry/sdk-trace-base';
import { OTLPTraceExporter } from '@opentelemetry/exporter-trace-otlp-http';

const otelColEndpoint =
 process.env.OTEL_COL_OTLP_ENDPOINT || 'http://localhost:4318';

console.log(`Exporting to traces to ${otelColEndpoint}`);

const exporter = new OTLPTraceExporter({
 url: otelColEndpoint,
});

const sdk = new opentelemetry.NodeSDK({
 spanProcessor: new SimpleSpanProcessor(exporter),
 serviceName: process.env.SERVICE_NAME,
});

sdk.start();
console.log(`${process.env.SERVICE_NAME}: Start Tracing...`);

let spanCounter = 0;
setInterval(() => {
 trace.getTracer('My Tracer').startSpan('Span number: #' + spanCounter++).end();
}, 5000);
Here you might start having issues. In order to solve these issues it's useful to look at the collector's logs.
First set the current context so you look at the OpenTelemery namespace by default:
kubectl config set-context --current --namespace=opentelemetry
Secondly, print all the pods in the namespace:
kubectl get pods
Copy the collector pod id and print its logs:
kubectl logs otel-collector-647fc9c4fd-g958h
Do it all in a one-liner:
kubectl logs `kubectl get pods | awk '/otel-collector/ {print $1}'`
You can also watch new logs by adding the -f flag to the command.
Now we are running the trace generator service. The minikube cluster is also up and running. But both Jaeger nor Aspecto received any traces. Where is the problem now? Looking at the collector's logs, we see no trace for traces (pun intended). Our collector never received any telemetry data.
- Issue #3 -- Traces being sent to the wrong collector's endpoint: Our trace generator sent traces to http://localhost:4318 but the collector expects to receive traces at /v1/traces. Changing the Collector endpoint inside the trace generator service worked.
We start seeing logs indicating that the trace was received by one of the receivers.
2022-10-08T07:14:16.204Z info TracesExporter {"kind": "exporter", "data_type": "traces", "name": "logging", "#spans": 1}
Here is a log printed by our logging exporter.
Looking at our visualization platforms, we still do not see any traces. Solving one issue at a time:
- Issue #4 -- Run Jaeger inside the cluster with its own service and deployment: Because localhost is a local interface IP address. Hosts, nodes, and pods have their own localhost interfaces and they are not connected to each other. This is also true for our local machine where the Jaeger image runs.
Let's deploy Jaeger inside the cluster with its own service and deployment.
Create a directory for all our Kubernetes manifests. Move the previous configuration and create a new jaeger.yml file:
mkdir otel-k8s
mv otel-collector-config.yml otel-k8s/otel-collector-k8s.yml
cd otel-k8s
touch jaeger.yml
In the Jaeger manifest, create a deployment with the same properties as the container we ran before with docker compose.
apiVersion: apps/v1
kind: Deployment
metadata:
 name: jaeger-all-in-one
 namespace: opentelemetry
 labels:
   app: opentelemetry
   component: otel-collector
spec:
 replicas: 1
 selector:
   matchLabels:
     app: opentelemetry
     component: otel-collector
 template:
   metadata:
     labels:
       app: opentelemetry
       component: otel-collector
   spec:
     containers:
       - image: jaegertracing/all-in-one:latest
         name: jaeger
         ports:
           - containerPort: 16686
           - containerPort: 14250
---
Make sure the labels and namespace are the same as the rest of our OpenTelemetry setup.
Add a headless service with a selector matching our deployments so they can communicate with each other.
apiVersion: v1
kind: Service
metadata:
 name: jaeger-all-in-one
 namespace: opentelemetry
 labels:
   app: opentelemetry
   component: otel-collector
spec:
 ports:
   - name: collector
     port: 14250
     protocol: TCP
     targetPort: 14250
 selector:
   app: opentelemetry
   component: otel-collector
Finally, add the Jaeger UI port 16686 to the load balancer and change the Jaeger exporter endpoint to the newly created deployment.
Add Jaeger to the load balancer list of ports:
 ports:
   - name: otlp-grpc
   ...
   - name: otlp-http
   ...
   - name: zpages
   ...
   - name: health-check
   ...
   - name: jaeger
     port: 16686
     protocol: TCP
     targetPort: 16686
Modify the Jaeger exporter:
exporters:
     otlp/aspecto: ...
     jaeger:
       endpoint: jaeger-all-in-one:14250
       tls:
         insecure: true
     logging:
Deploy by applying the entire directory:
kubectl apply -f ./
Now, let's look at Jaeger UI at localhost:16686, and voila:
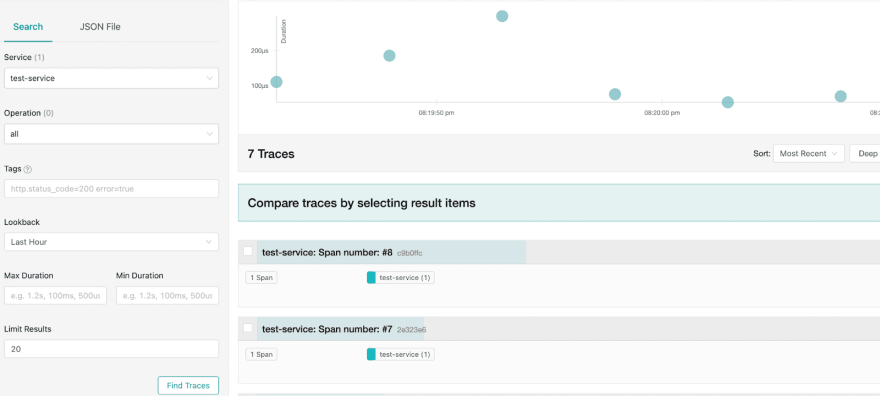
We can see traces from our trace service.
Time to handle the issue with our second exporter
- Issue #5 -- Set a Kubernetes Secret resource for your secret environment variables: In previous tutorials, we used environment variables to pass the remote tracing platform's credentials. But here it doesn't work. The correct way to handle sensitive information is with Secrets.
Let's create a secret using kubectl:
kubectl create secret generic aspecto --from-literal=api-key=$ASPECTO_API_KEY
Verify the secret was created and encrypted by running:
kubectl get secrets -o json
We get back a JSON with the api-key encrypted. Let's add the ASPECTO_API_KEY environment variable to the container:
...
containers:
 - command:
     - '/otelcol'
     - '--config=/conf/otel-collector-config.yaml'
   env:
     - name: ASPECTO_API_KEY
       valueFrom:
         secretKeyRef:
           name: aspecto
           key: api-key
           optional: false
   image: otel/opentelemetry-collector:latest
...
Now, after re-running our cluster we can see traces in both our visualization platforms:
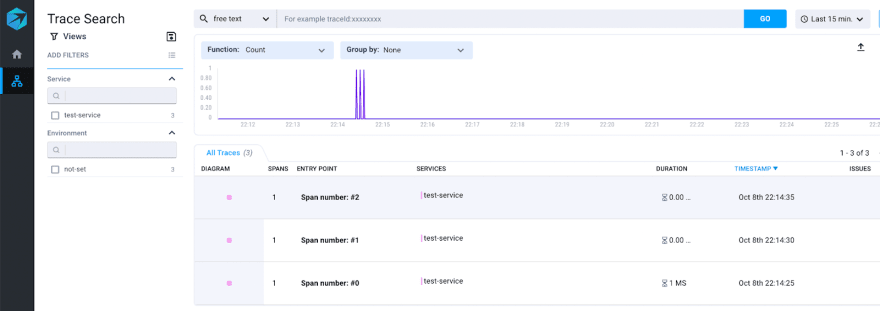
We have a working local gateway for telemetry data.
Final Thoughts and Next Steps
Setting up your Kubernetes cluster to start collecting telemetry data could be a challenging task. In this guide, we set up a working OpenTelemetry Collector that is configured to receive data in OTLP format via Http or gRPC.
We then ran the collector using Kubernetes. Lastly, we attempted to solve some of the most common issues you might encounter as a beginner with OpenTelemetry and Kubernetes.
This guide is suitable for practice and learning. For real-world production systems, I recommend reading the following articles:
- How to set up a collector as an agent -- Part 2
- How to use the OpenTelemety Collector Helm chart for all your heavy lifting -- Part 3
Thanks for reading, and please let me know if you have any questions about this article.

Top comments (0)