


You have a failure open in the Playwright HTML report. You read the exception, switch to your editor to inspect the code, then return to the report to check another attempt or earlier result.
I wanted to make that investigation easier to do where the code already is.
Playwright Logbook for VS Code brings the Logbook investigation workflow into the IDE: Recent Runs → run overview → test details → attempts and history → source. Analyze with AI also prepares a failure-analysis task for your chosen coding assistant chat.
The open-source Logbook reporter saves the run evidence and history; the extension brings those records beside your code. New to the reporter? Start with A Playwright reporter that remembers your runs and briefs your coding assistant.
Open Logbook: 🧩 VS Code Marketplace · 📦 Reporter on npm · ⭐ GitHub repository
Use the reporter to collect your usual local runs. Then browse their summaries, inspect errors and available diagnostics, compare recorded executions, and open source without repeatedly switching between the report and editor.
Get a useful first run in a few steps
Install the extension:
code --install-extension krishnapollu.playwright-logbook-vscode
Or search for Playwright Logbook, publisher krishnapollu, in VS Code.
The extension reads history collected by the Logbook reporter. Add that reporter to your existing project:
npm install --save-dev playwright-logbook
// playwright.config.ts
import { defineConfig } from '@playwright/test';

export default defineConfig({
  reporter: [
    ['list'],
    // Opt-in: capture steps, output tails and eligible image previews.
    ['playwright-logbook', { captureDetails: true }],
  ],
  use: {
    screenshot: 'only-on-failure',
    trace: 'on-first-retry',
  },
});
captureDetails defaults to false; this example opts in to extra diagnostics. trace: 'on-first-retry' captures a trace only when a first retry occurs—it does not enable retries. Keep your existing retry policy, or use --retries=1 when trying this on a demo suite.
npx playwright test
Open Logbook in the activity bar. Keep .logbook/runs/ and .logbook/index.jsonl between runs so you have history to inspect.
If your Playwright project lives in a subfolder, set the history and source paths first (see A couple of setup details worth getting right below).
The extension supports desktop VS Code 1.95+ on macOS, Windows and Linux in local workspaces only (no Remote SSH, containers or browser-based VS Code). The reporter requires Node.js 20+ and Playwright 1.42+.
Browse runs from the sidebar
The native Recent Runs sidebar is your starting point. Expand a saved run to see its results or choose Run overview when you need the whole-run picture.
Click any screenshot to inspect the original image at full resolution.
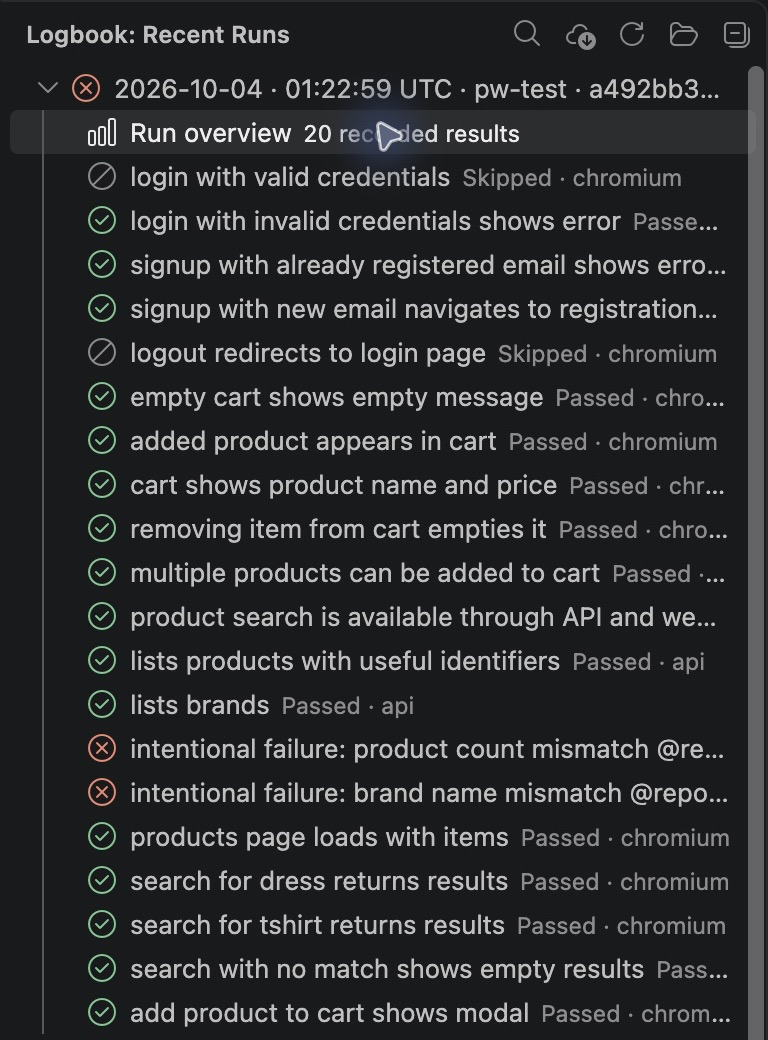
The native tree keeps the run and its recorded results within reach while you work in VS Code.
The overview shows recorded outcome totals, project breakdowns, a clickable cases list and run-level errors when recorded. Select a case to investigate it; the sidebar search action helps find a test in a larger run.
You can review a saved run without executing the suite again.
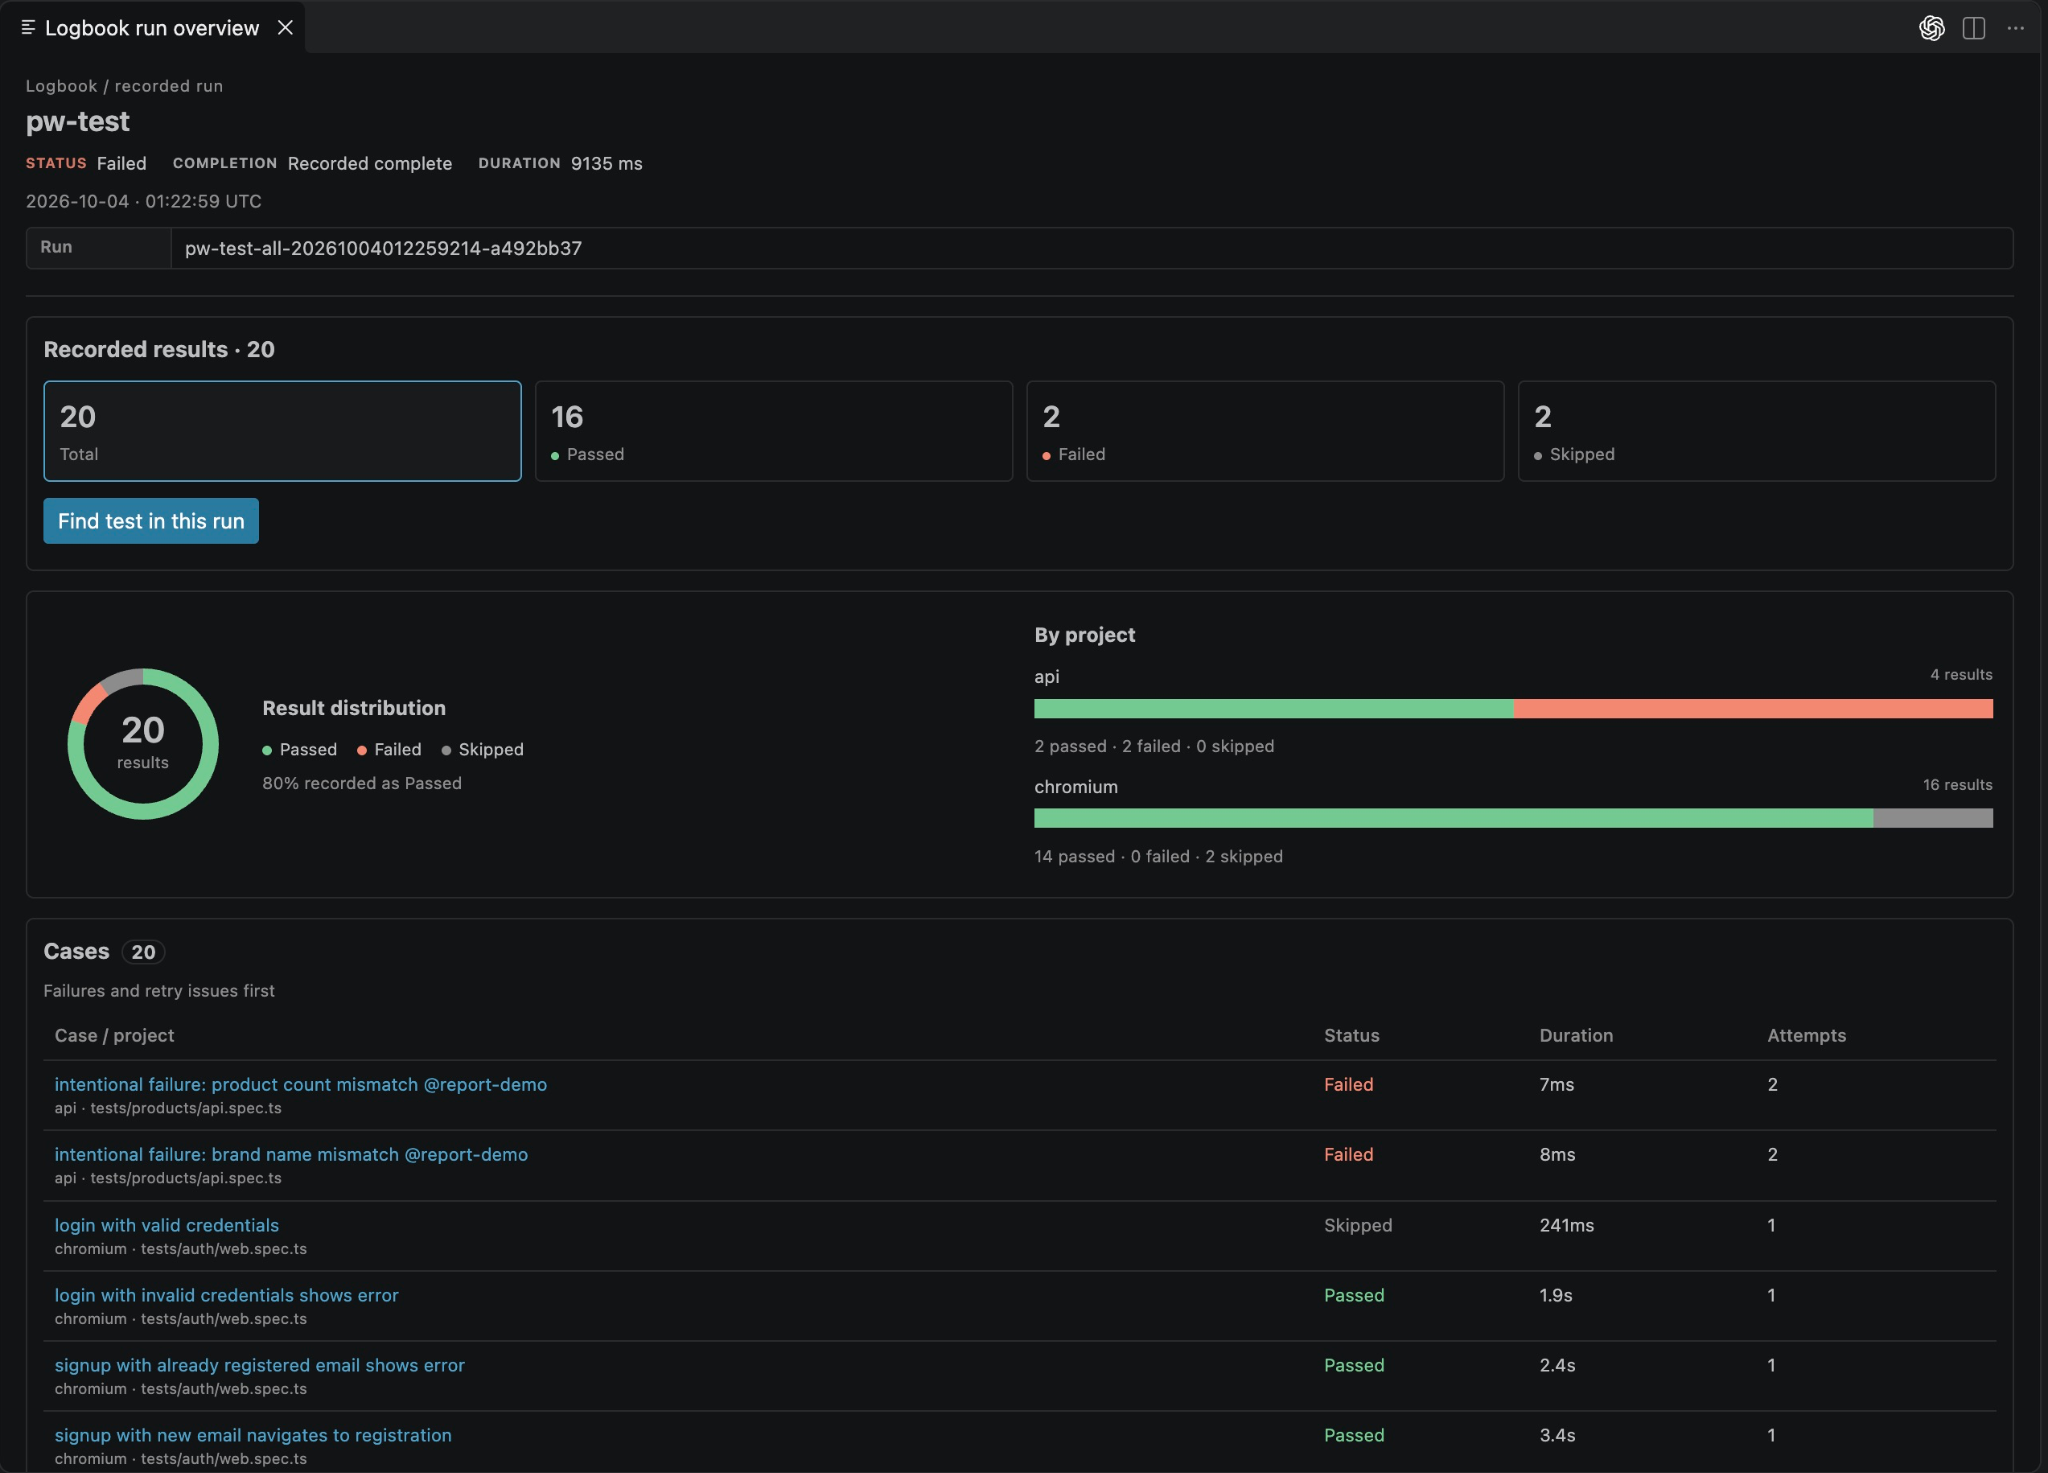
The selected pw-test run has 16 passes, two deliberate failures and two skips; the cases list links into individual results.
Filter to the tests you are working on
Use the live filter to narrow saved runs and results by test name, spec path, project, status, branch, commit or other recorded metadata. Search older runs extends the loaded history; Clear resets the filter.
You can also start from your code: right-click a spec or test file in Explorer to filter to that file, or right-click inside a test and choose Logbook: Filter This Test. The sidebar then shows the relevant runs and results.
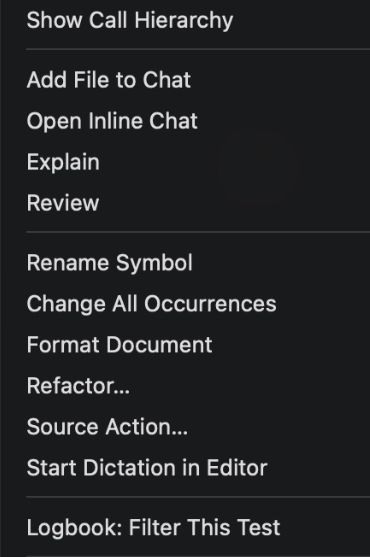
Filter directly from the test you are inspecting in the editor.
Keep test diagnostics beside your code
Select a test to see its recorded outcome, error, assertion details and source excerpt. The test view keeps the available Steps, Logs, Errors and Attachments close to its attempts and execution history.
Use Open failure location to inspect the relevant code, then return to the same result to review the diagnostic. You can also open the recorded test definition. Historical line numbers may have moved in your current checkout.
That matters when an initial attempt fails but a retry succeeds. The final outcome is useful, but the earlier diagnostic may tell you what to investigate next.
captureDetails: true enables optional diagnostic capture for new runs. Eligible bounded PNG/JPEG images can be previewed; missing capture data stays unavailable. Existing runs cannot acquire evidence retrospectively.
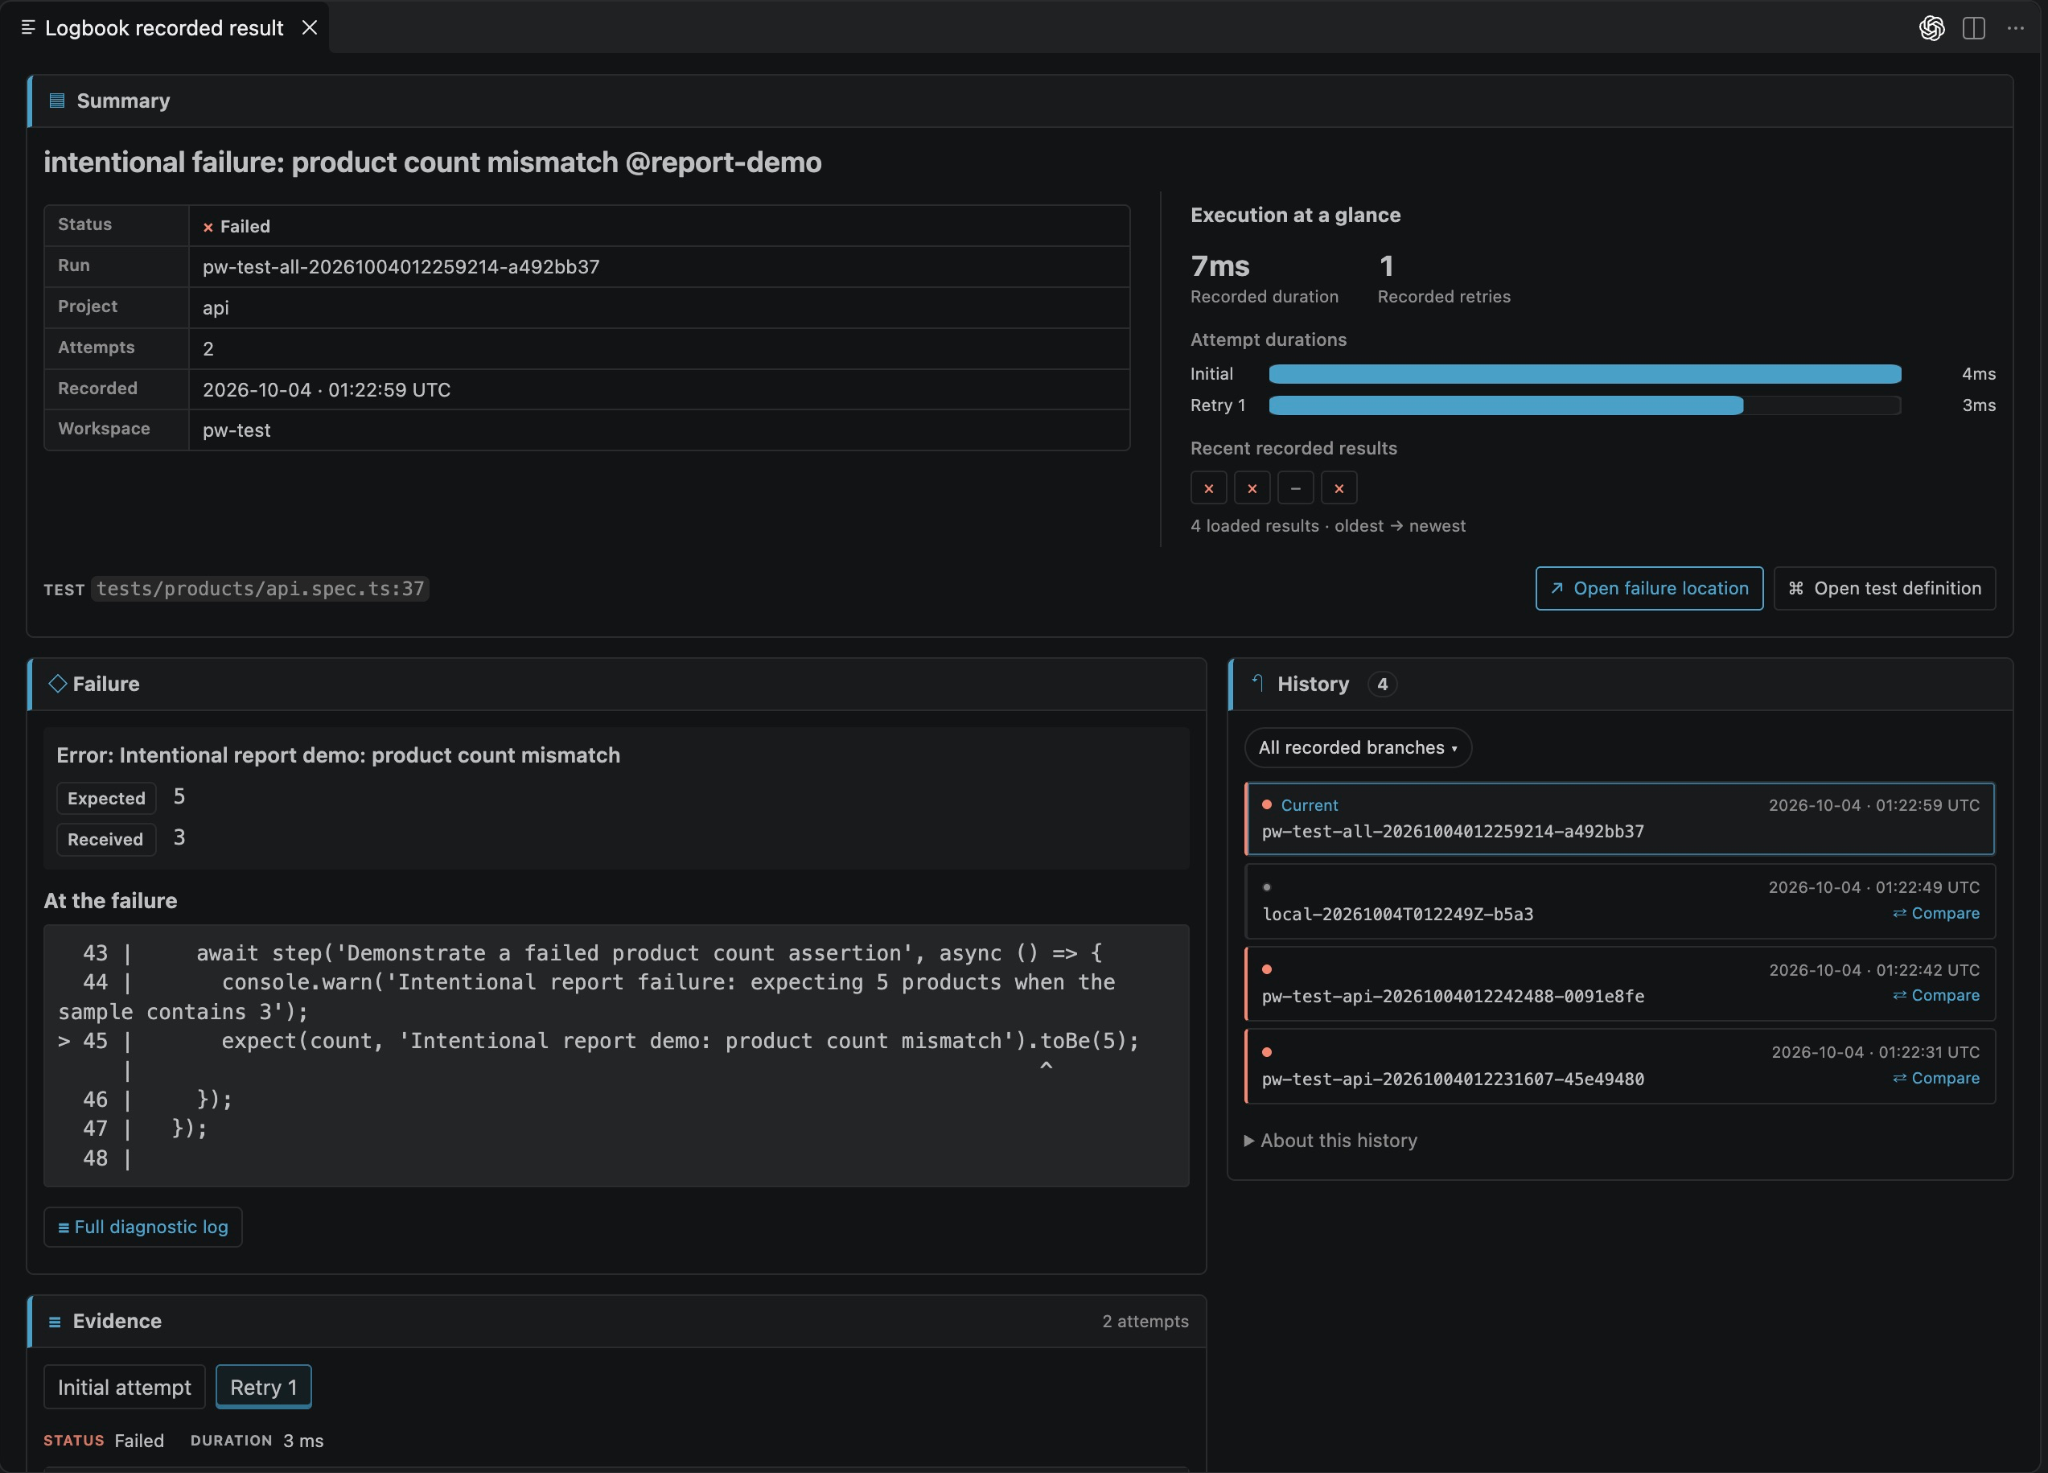
A deliberate assertion failure keeps its code frame, retry summary, source actions and matching test history together.
Analyze the failure with your coding assistant
Analyze with AI prepares an unsent task in your chosen assistant chat, so you can ask for analysis without assembling the context by hand. Review the task and evidence for secrets before submitting.
- Open a test result and choose ✧ Analyze with AI ▾ beside the source actions.
- On first use, pick an installed coding assistant or native VS Code Chat. Logbook remembers your choice for that workspace; use the arrow to change it.
- In a supported assistant, review the prepared unsent draft, choose your model, and submit it. Read the analysis and continue the investigation in that assistant's chat.
The task points to saved failure context: the selected execution, errors, attempts, captured steps and output, attachment references, matching history, and a bounded excerpt of current test source when available. The prompt asks for a concise analysis with a likely cause, supporting evidence and next steps. Current source may differ from the recorded run, and missing diagnostics remain missing.
In the current release, supported handoffs include native VS Code Chat, Codex, Antigravity, Amazon Q and Cline. Analysis requires Workspace Trust and access to your chosen assistant. If an assistant's input integration is unsupported, Logbook reports it so you can choose another.
Logbook prepares the handoff; it does not submit the request or read the answer. Submitting sends the task, and any evidence the assistant reads, to that assistant and whichever model provider it uses, under that tool’s settings and policies. Text filtering does not guarantee that every secret is removed and cannot remove secrets visible in screenshots.
The action sits beside the source controls. Its arrow changes the saved assistant choice.
Compare the test across recorded executions
The History panel lets you select another recorded execution of the matching test/project or compare it with the selected result.
The comparison brings together outcomes, available errors, attempts and labeled durations, so you can inspect the difference between two recorded executions within the test workflow. Recorded branch and commit information supplies context when present.
Start with an earlier local run of the same test. A useful comparison might reveal that the final outcome stayed failed but the recorded error changed, or that a pass required more attempts. Those are observations to investigate, rather than an automatic diagnosis.
The useful question becomes more specific:
Did the same test fail in an earlier execution, and how do the recorded attempts and errors differ?
History is limited to available records and the selected scope. Matching error text does not establish a shared root cause, and one successful retry does not prove a test is now reliable.
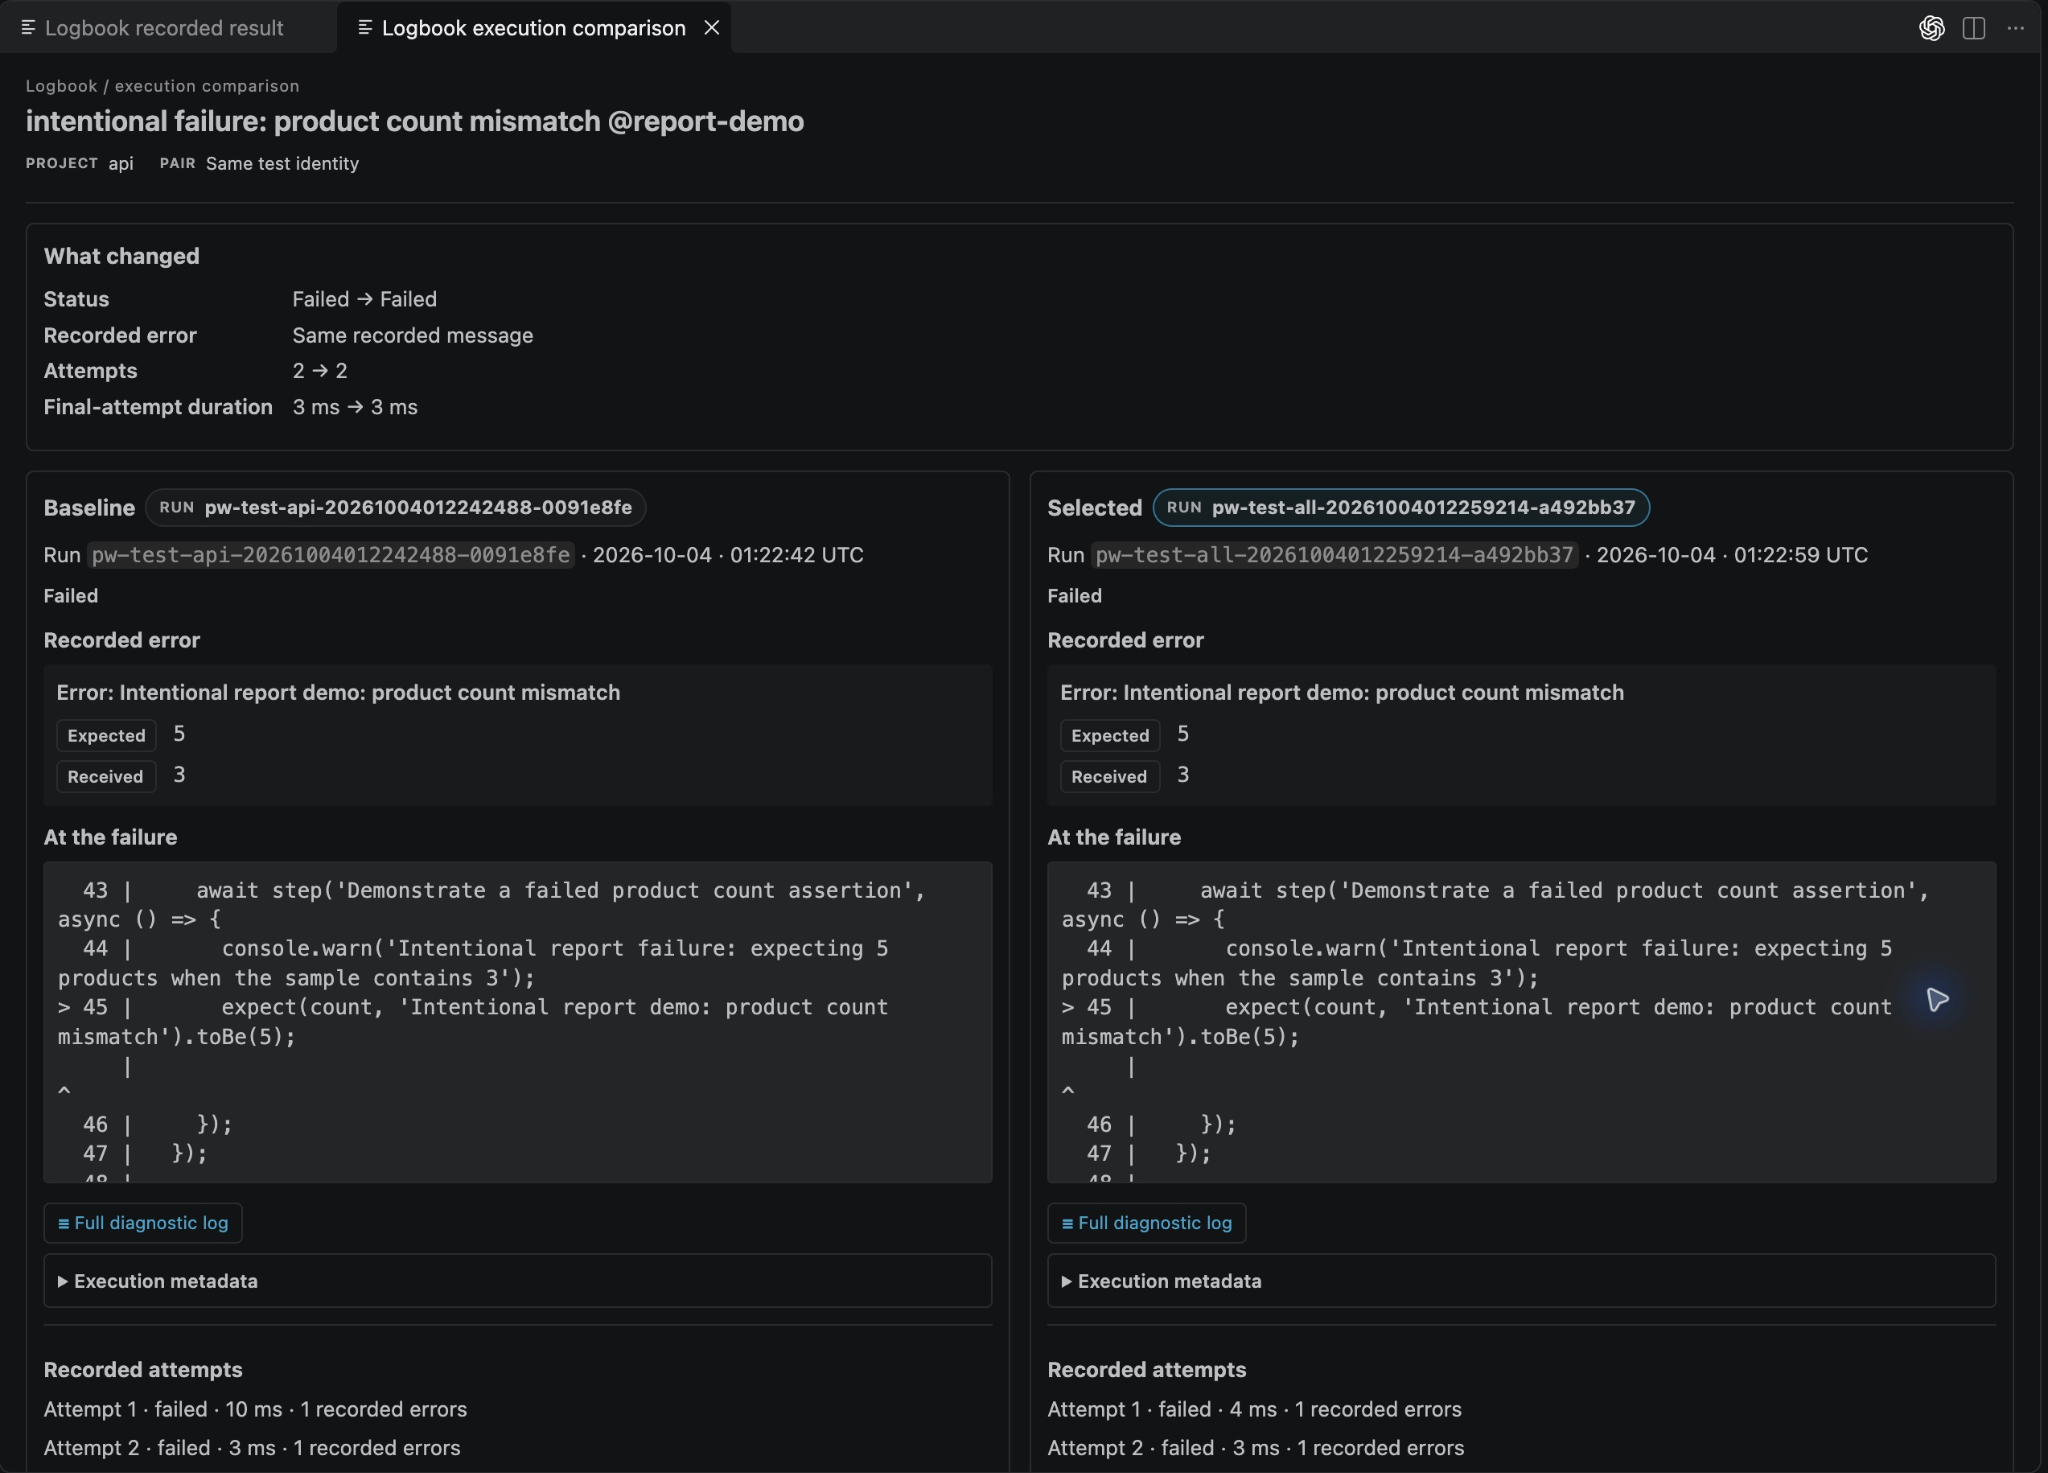
Two executions of the same pw-test case both failed with the same recorded message. The comparison still exposes their run identities, attempts and durations.
Inspect source changes with native Git diffs
When recorded revisions are available locally, the comparison shows a committed test-file diff beside the recorded outcome changes. Open either revision’s source or choose View full file diff for the native Git diff. Git actions require Workspace Trust and local Git.
No fetch or checkout is performed. A recorded commit shows committed content; it cannot reconstruct uncommitted changes that were present during execution. The extension keeps that limitation visible rather than presenting code changes as a confirmed failure cause.
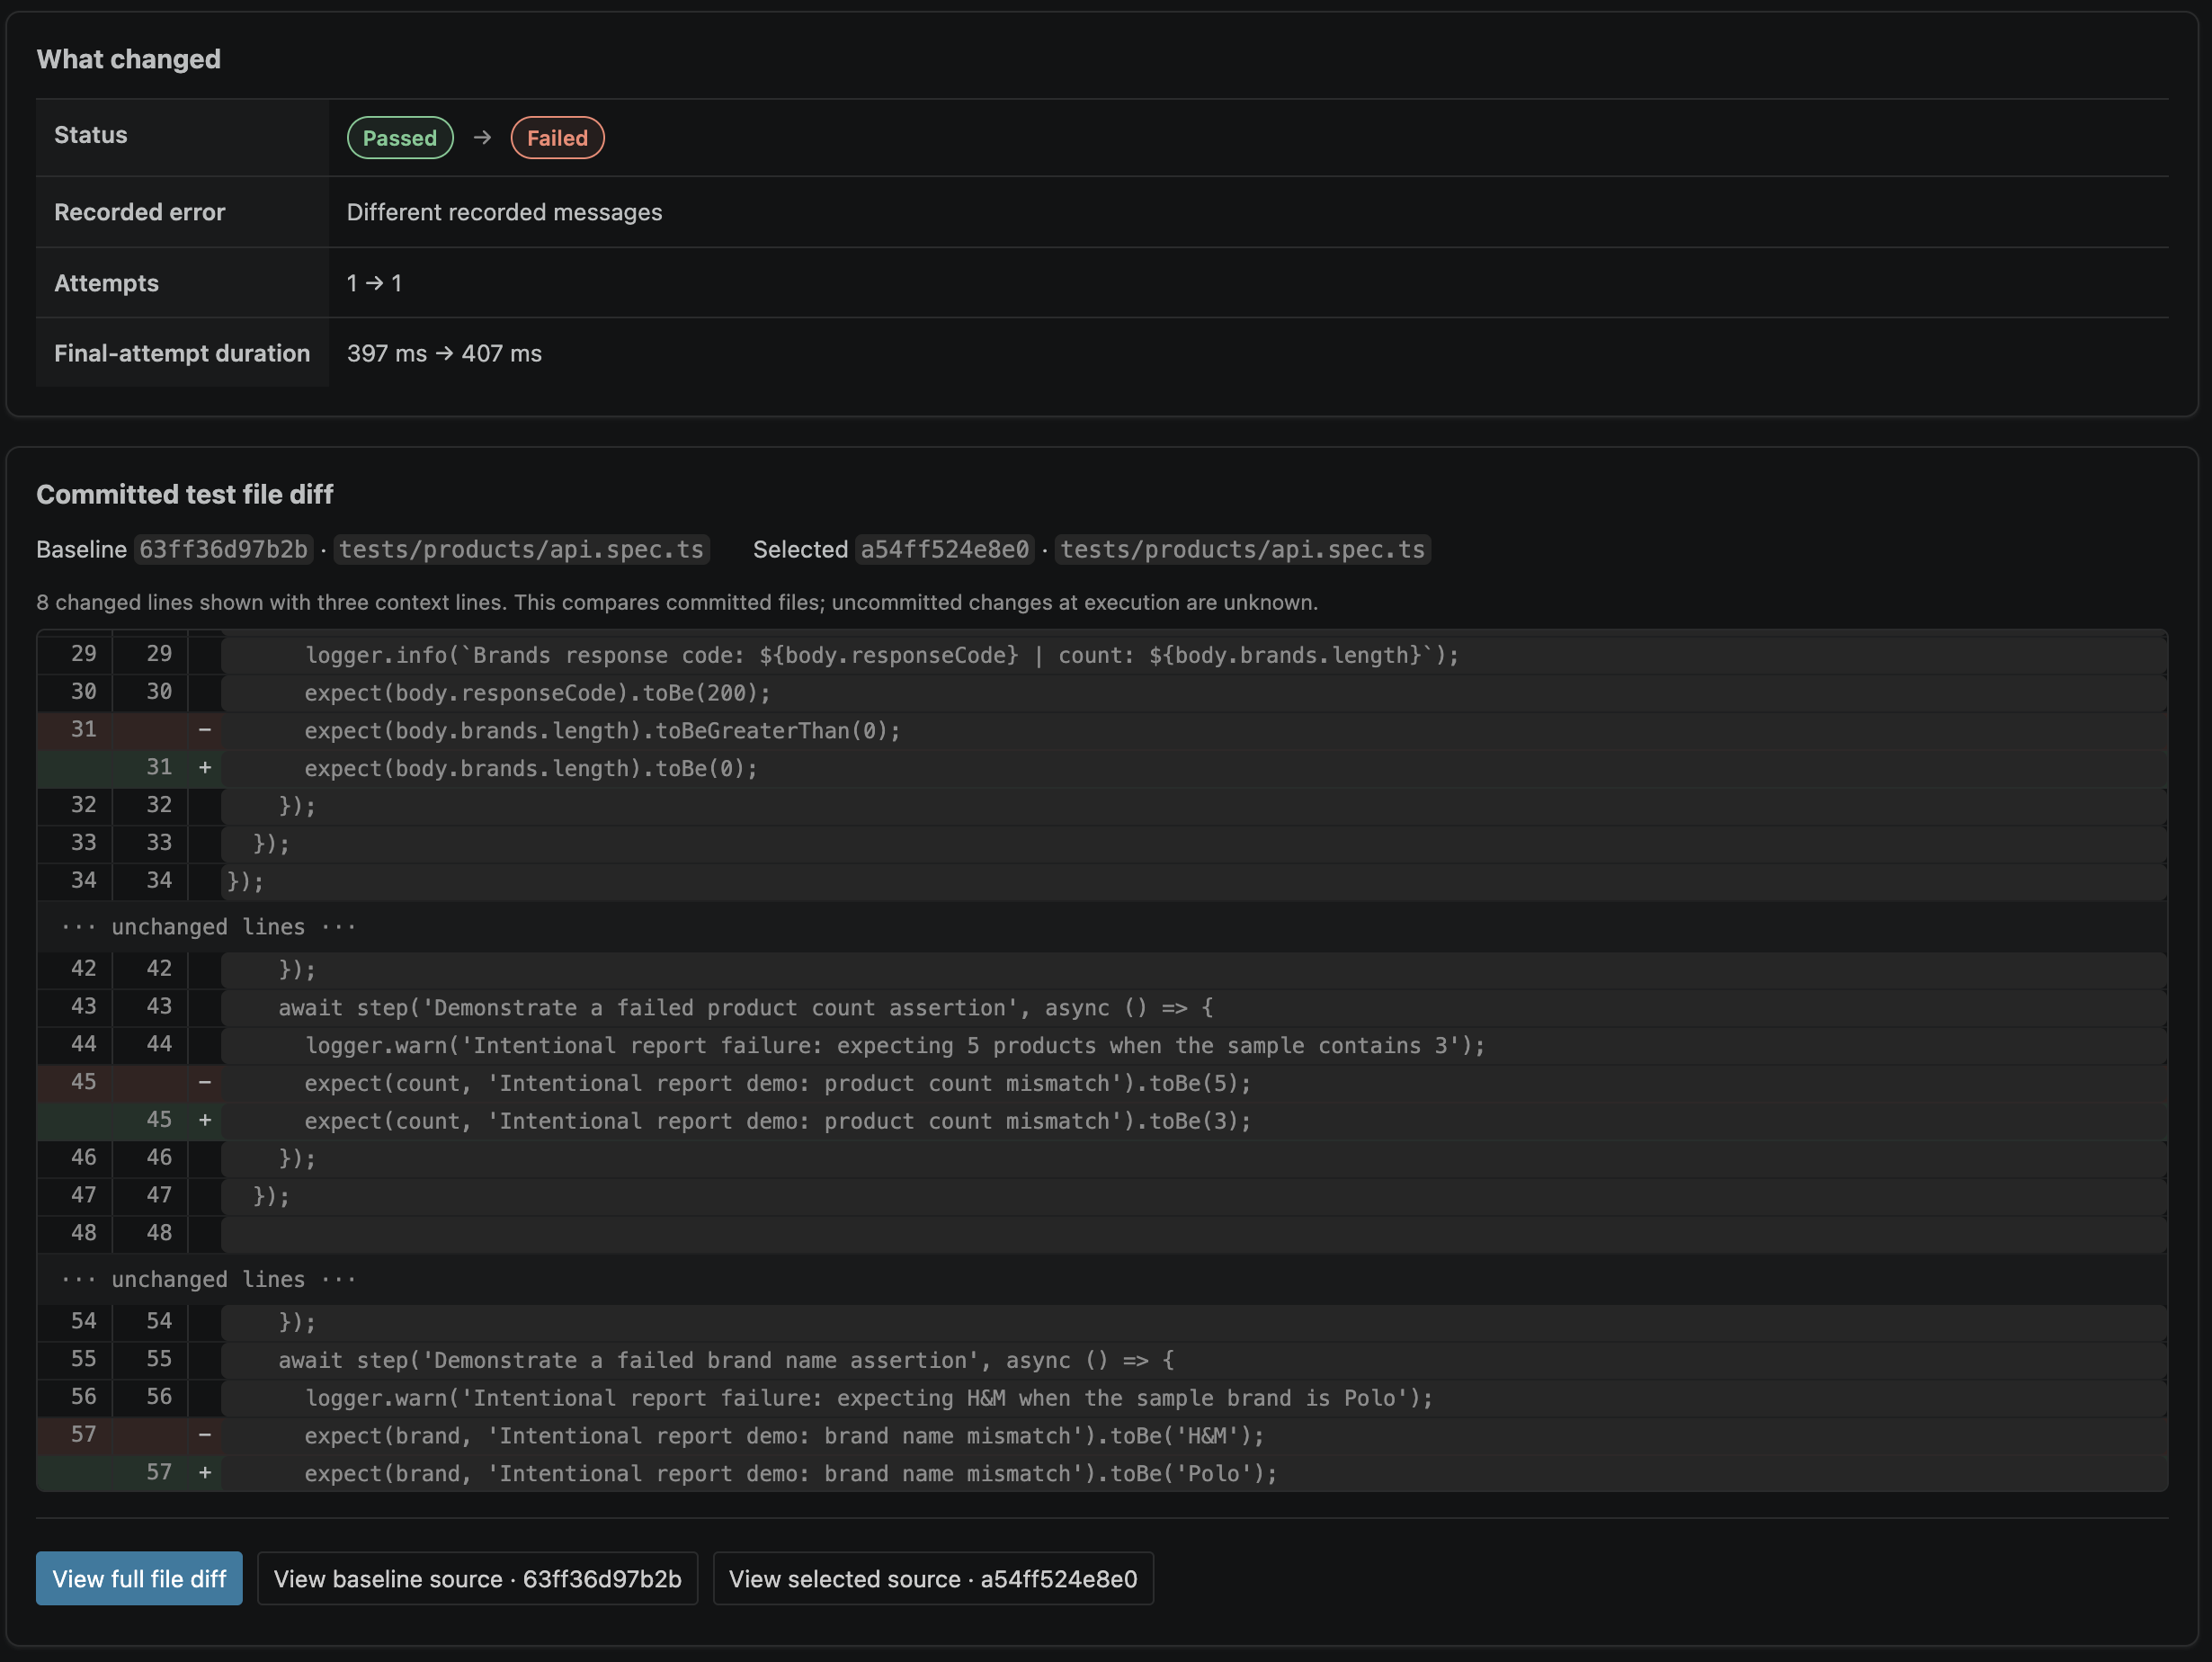
Recorded outcome changes and committed assertion edits appear together, with actions to open the full diff or either revision’s source.
An added option: import a CI run bundle
The same workflow can also include a recorded CI execution. With reporter 0.3.0+, export a saved run as a portable bundle and download it locally:
In CI, after the run is saved and after merging shards if your jobs are sharded:
npx playwright-logbook export \
  --artifacts \
  --out ci-investigation.logbook.zip \
  --project-id checkout-tests
After downloading the bundle:
- Choose Logbook: Import Run Bundle… from the Command Palette or sidebar.
- Select the ZIP and use the same stable project ID as CI.
- Review the validation results, then choose Import and Open Imported Run.
Imported results join local history when test and project identities match; branch scope still applies. Duplicate/conflicting records are checked. Renamed tests are not automatically reconciled.
This is a local, reviewed import. The extension does not automatically download CI artifacts. For sharded jobs, merge the run before exporting its bundle.
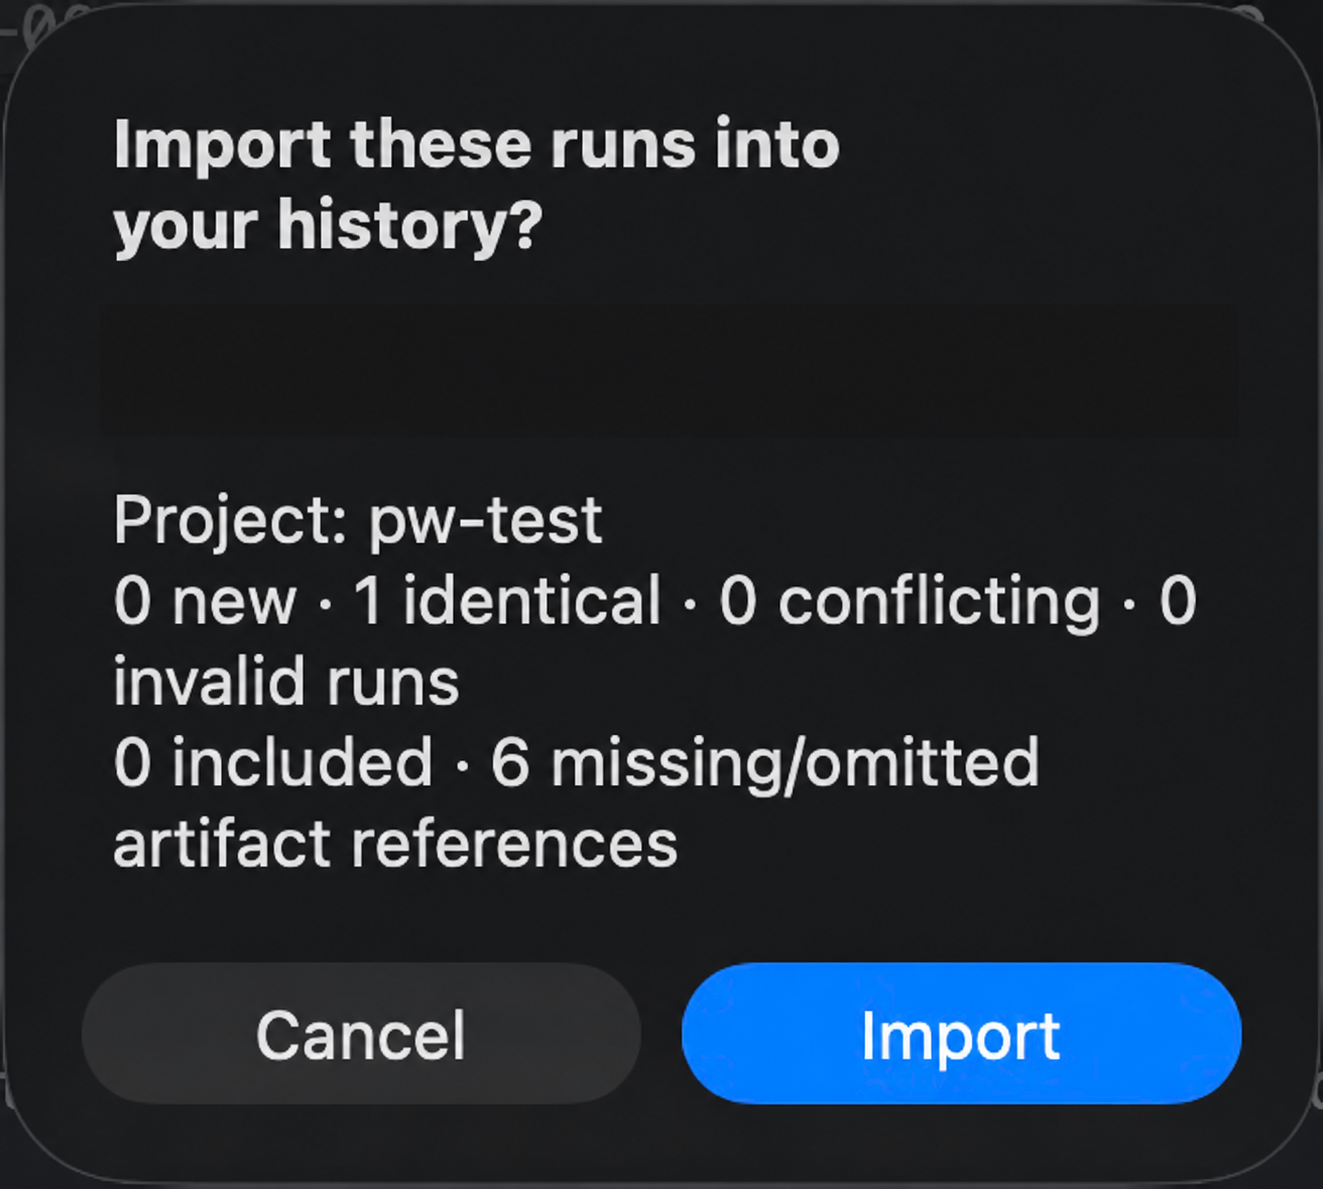
The review reports what the bundle would add before import. This example has zero new runs, one identical run and six missing or omitted artifact references; the capture was taken without completing the import.
A couple of setup details worth getting right
If your Playwright project is nested inside a repository, map the history and source roots:
{
  "logbook.historyPath": "e2e/.logbook",
  "logbook.sourceRoot": "e2e"
}
Select the history folder containing index.jsonl and runs/, not just the HTML report.
Imported trace/video files can retain their evidence and metadata, but embedded trace viewing and video playback are not available. Full screen-reader validation is ongoing.
Fits alongside your existing tools
Keep using Playwright's official extension to run, generate and debug tests, and its Trace Viewer for detailed execution inspection. Logbook adds a saved-history investigation workflow and an optional handoff to your coding assistant. You review and submit the AI task in that assistant’s chat.
You can try it on a small suite first: collect a few runs, inspect an earlier failure, and see whether the trip from evidence to source is easier.
- Install Playwright Logbook for VS Code
- Reporter on npm
- Setup and troubleshooting
- Source, feedback and issues
Try Logbook on a suite you already investigate. Which part would help most: clearer exceptions and attempts, run triage, history, or a better handoff to your coding assistant? Share your thoughts, feature ideas or experience in the comments, or open an issue. If it helps your workflow, a ⭐ on GitHub helps other Playwright users find it.
Topics: #testautomation · #devtools · #opensource · #ai · #playwright · #reporting · #debugging · #playwright-logbook


Top comments (0)