


A red test result starts an investigation. Which attempt failed? What did the assertion actually say? Was this test failing on earlier runs? Where is the evidence you would hand to a teammate or coding assistant?
Playwright Logbook is an open-source reporter that keeps failure diagnostics, retries, run-to-run changes and history in one local HTML report. Its CLI can also give a coding assistant a focused, reviewable packet of recorded evidence.
Try Logbook: 📦 Reporter on npm · 🧩 VS Code extension · ⭐ GitHub repository
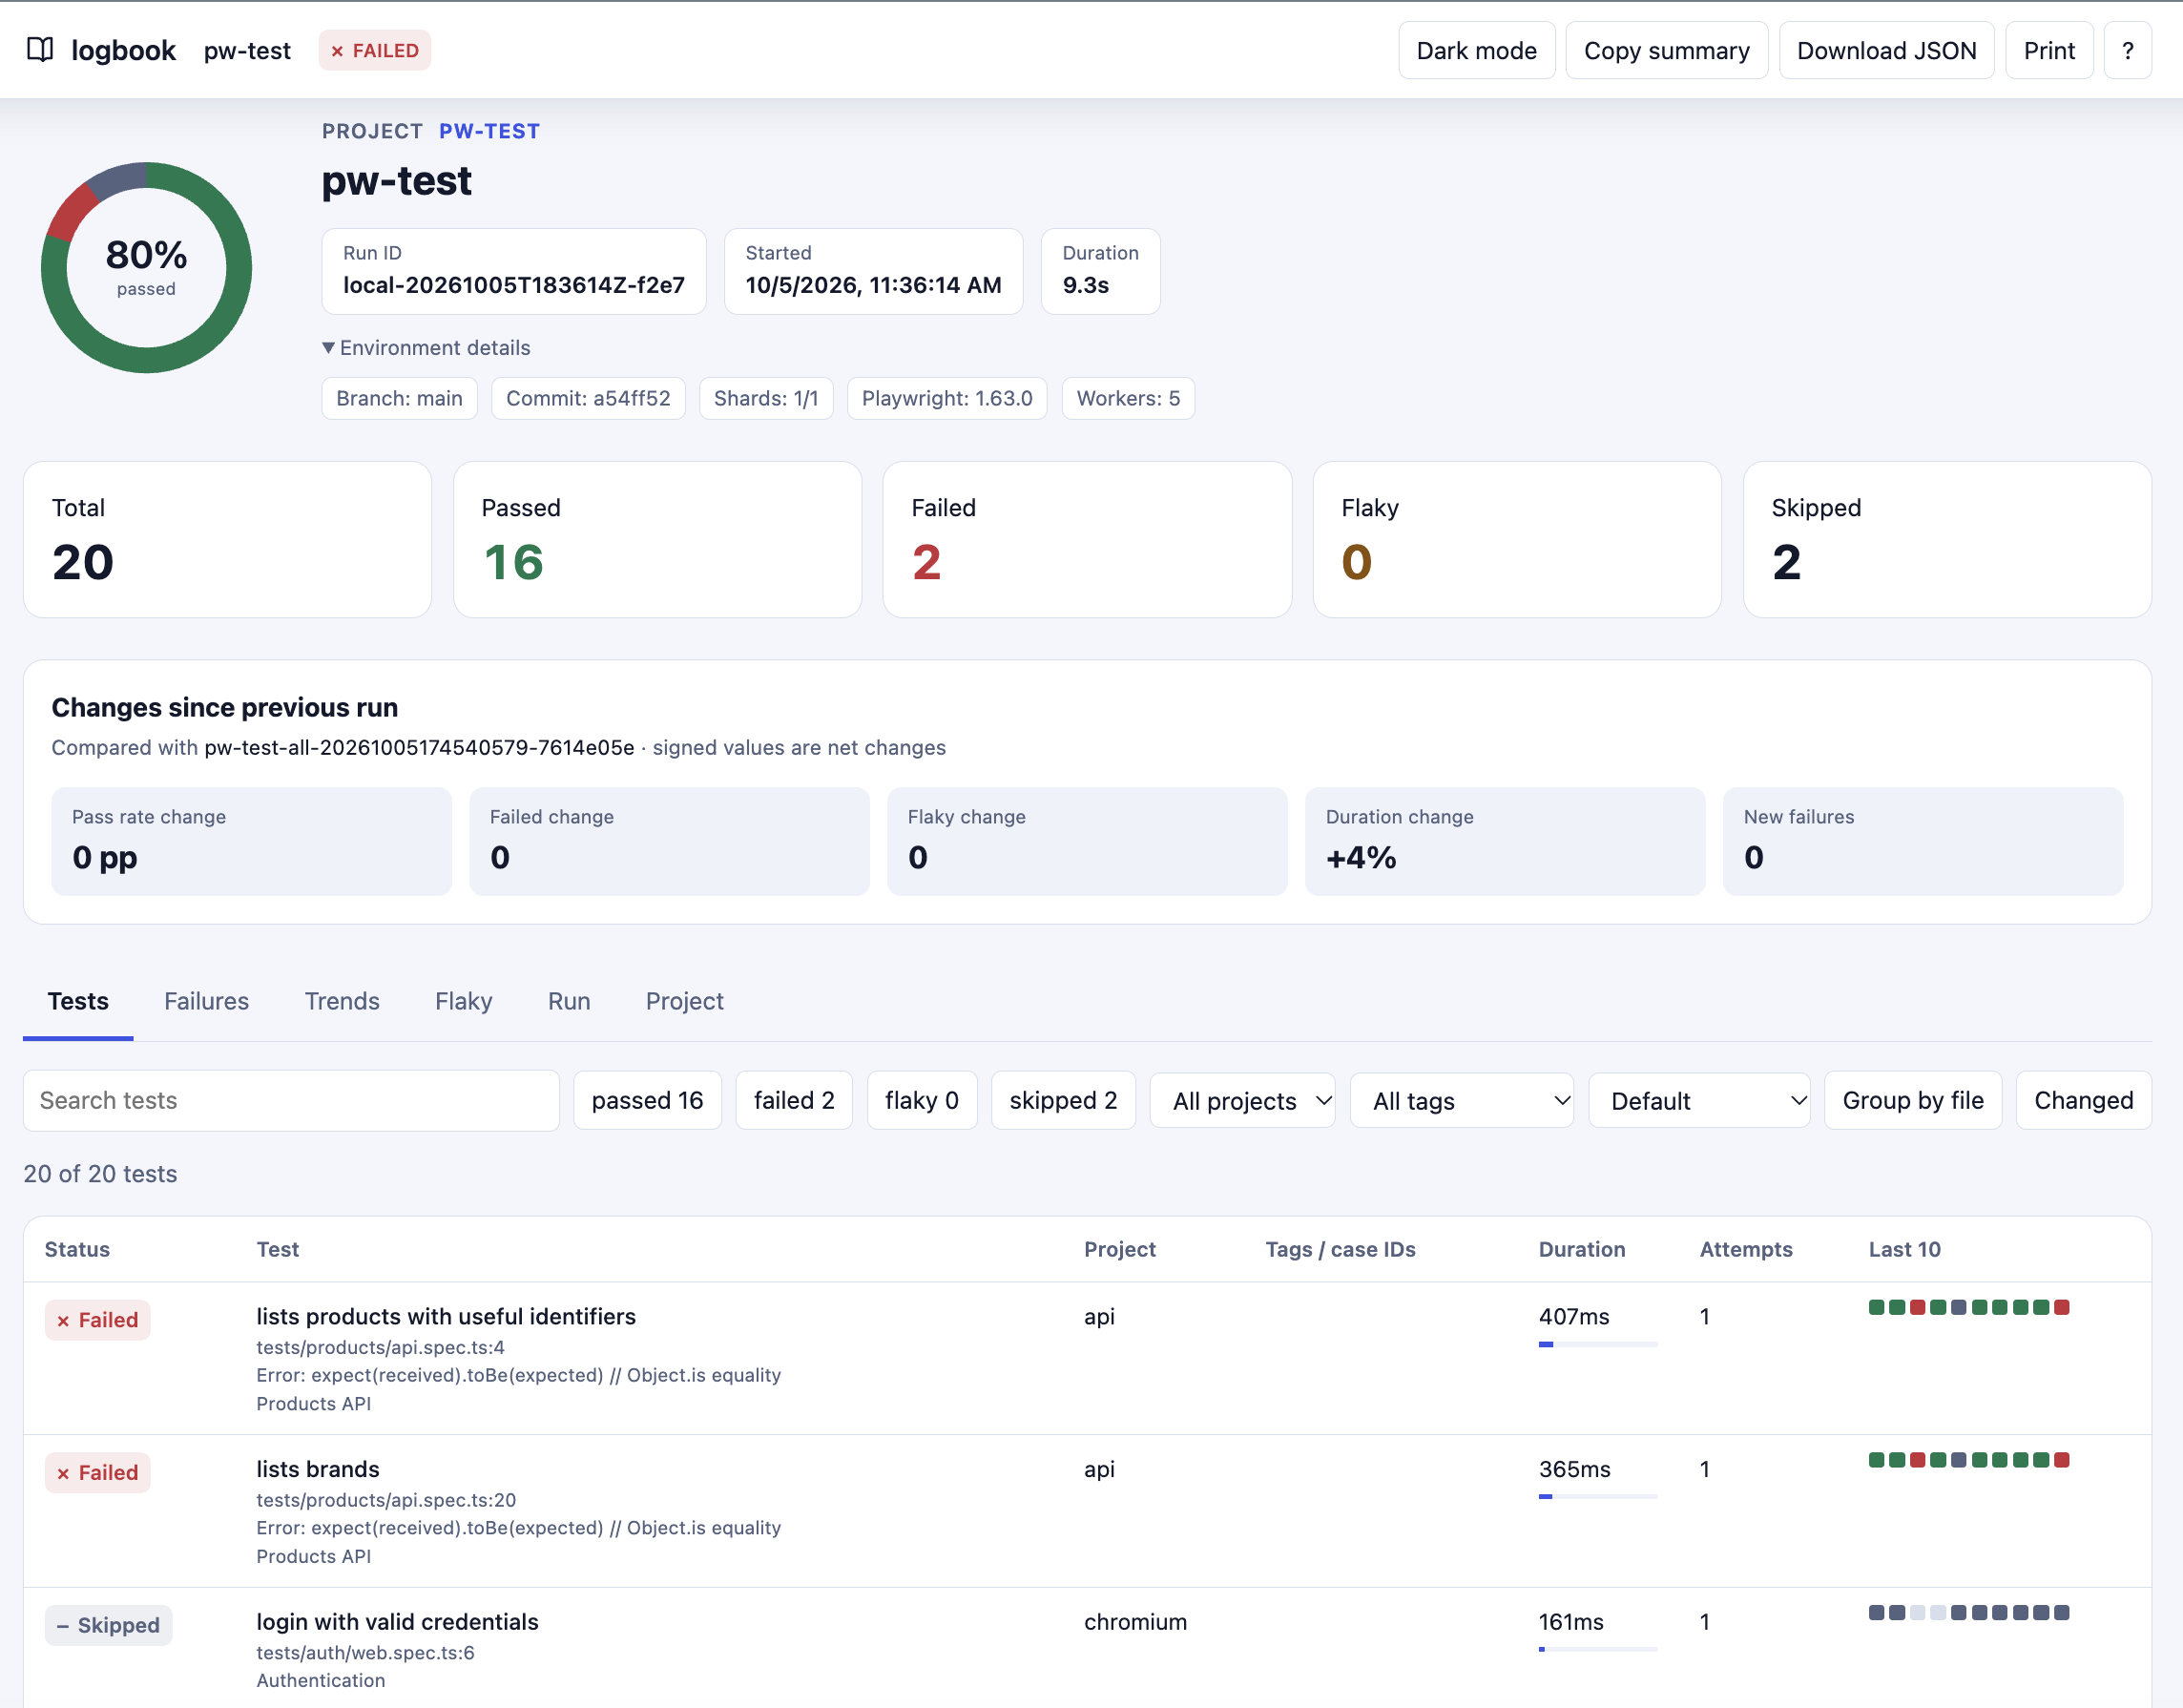
pw-test is a demo project. This saved run has 20 results across API and Chromium projects, including two failing API tests. These are sample diagnostics, not a production incident or a performance benchmark. Click a screenshot to inspect its original resolution. Screenshots come from saved demo runs and may differ between tabs.
Playwright's HTML report and Trace Viewer are useful. Logbook focuses on the next steps: bringing the exception, attempts, available artifacts, saved-run changes and a debug packet with source excerpts into one workflow.
Try it in your Playwright project
npm install --save-dev playwright-logbook
// playwright.config.ts
import { defineConfig } from '@playwright/test';

export default defineConfig({
  reporter: [
    ['list'],
    // Opt-in: capture steps, output tails and eligible image previews.
    ['playwright-logbook', { captureDetails: true }],
  ],
  use: {
    screenshot: 'only-on-failure',
    trace: 'on-first-retry',
  },
});
captureDetails defaults to false. The example opts in to extra diagnostics. trace: 'on-first-retry' captures a trace only if a first retry occurs; it does not enable retries. Keep your existing retry policy, or use --retries=1 when trying this on a demo suite.
Run npx playwright test, then open .logbook/report/index.html. The single HTML file opens locally without a server. Keep .logbook/runs/ and .logbook/index.jsonl to build history. The reporter requires Node.js 20+ and Playwright 1.42+.
Give your coding assistant the recorded evidence
A pasted error is only part of the story. For a quick handoff, open the test in the HTML detail panel, use Preview debug context, review it for secrets, then Copy debug context to share the recorded evidence with your coding assistant.
For an assistant with terminal and file access to your project, the CLI offers a debug packet for one test in one run:
npx playwright-logbook history --limit 10 --json
npx playwright-logbook summary --run latest --format json
npx playwright-logbook debug --run latest --test YOUR_TEST_ID --format json
Find the recorded testId in .logbook/runs/<run-id>.json; the summary gives aggregate counts, not a list of every failed test. The debug packet includes available attempt outcomes, errors, source excerpts, steps and output, attachment metadata, recent outcomes, evidence IDs and a rerun command. Ask for the same test ID from an earlier run to compare the two packets. There is no separate CLI diff command.
Logbook does not call an AI provider or fix tests automatically. Missing evidence is called out rather than invented. Review packets and attachments before sharing: text redaction does not guarantee that every secret is removed, and it cannot remove secrets visible in screenshots.
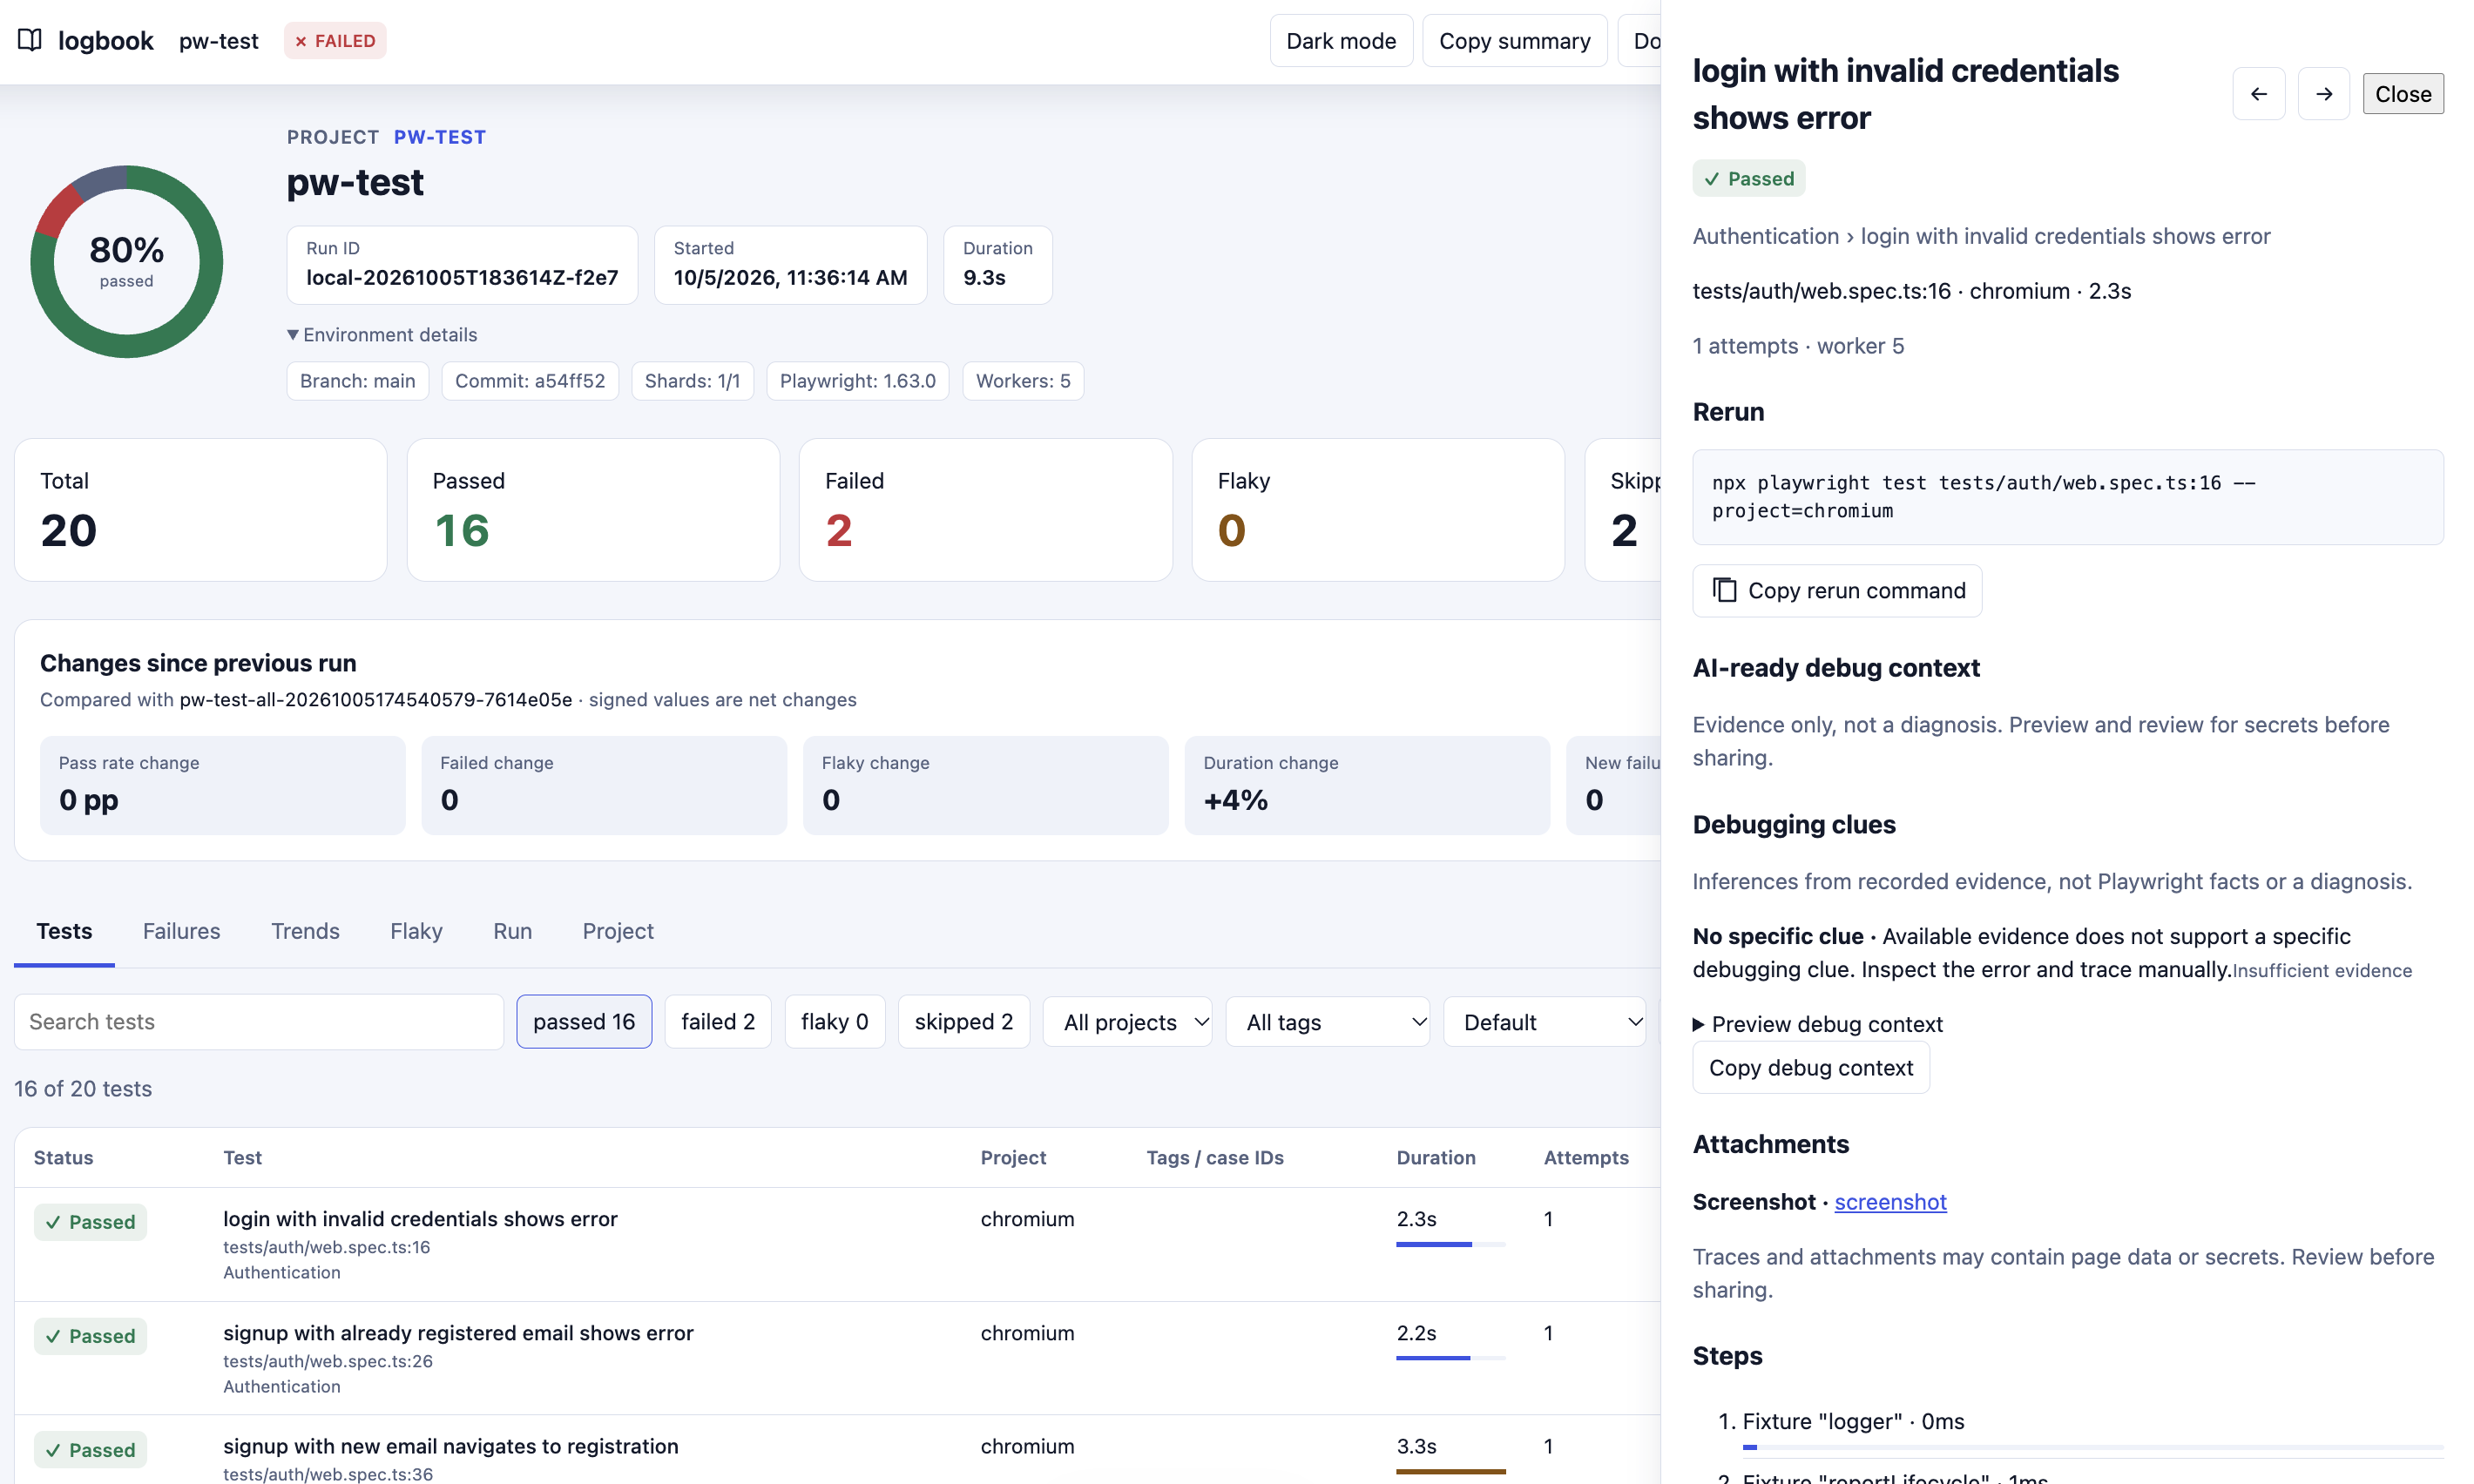
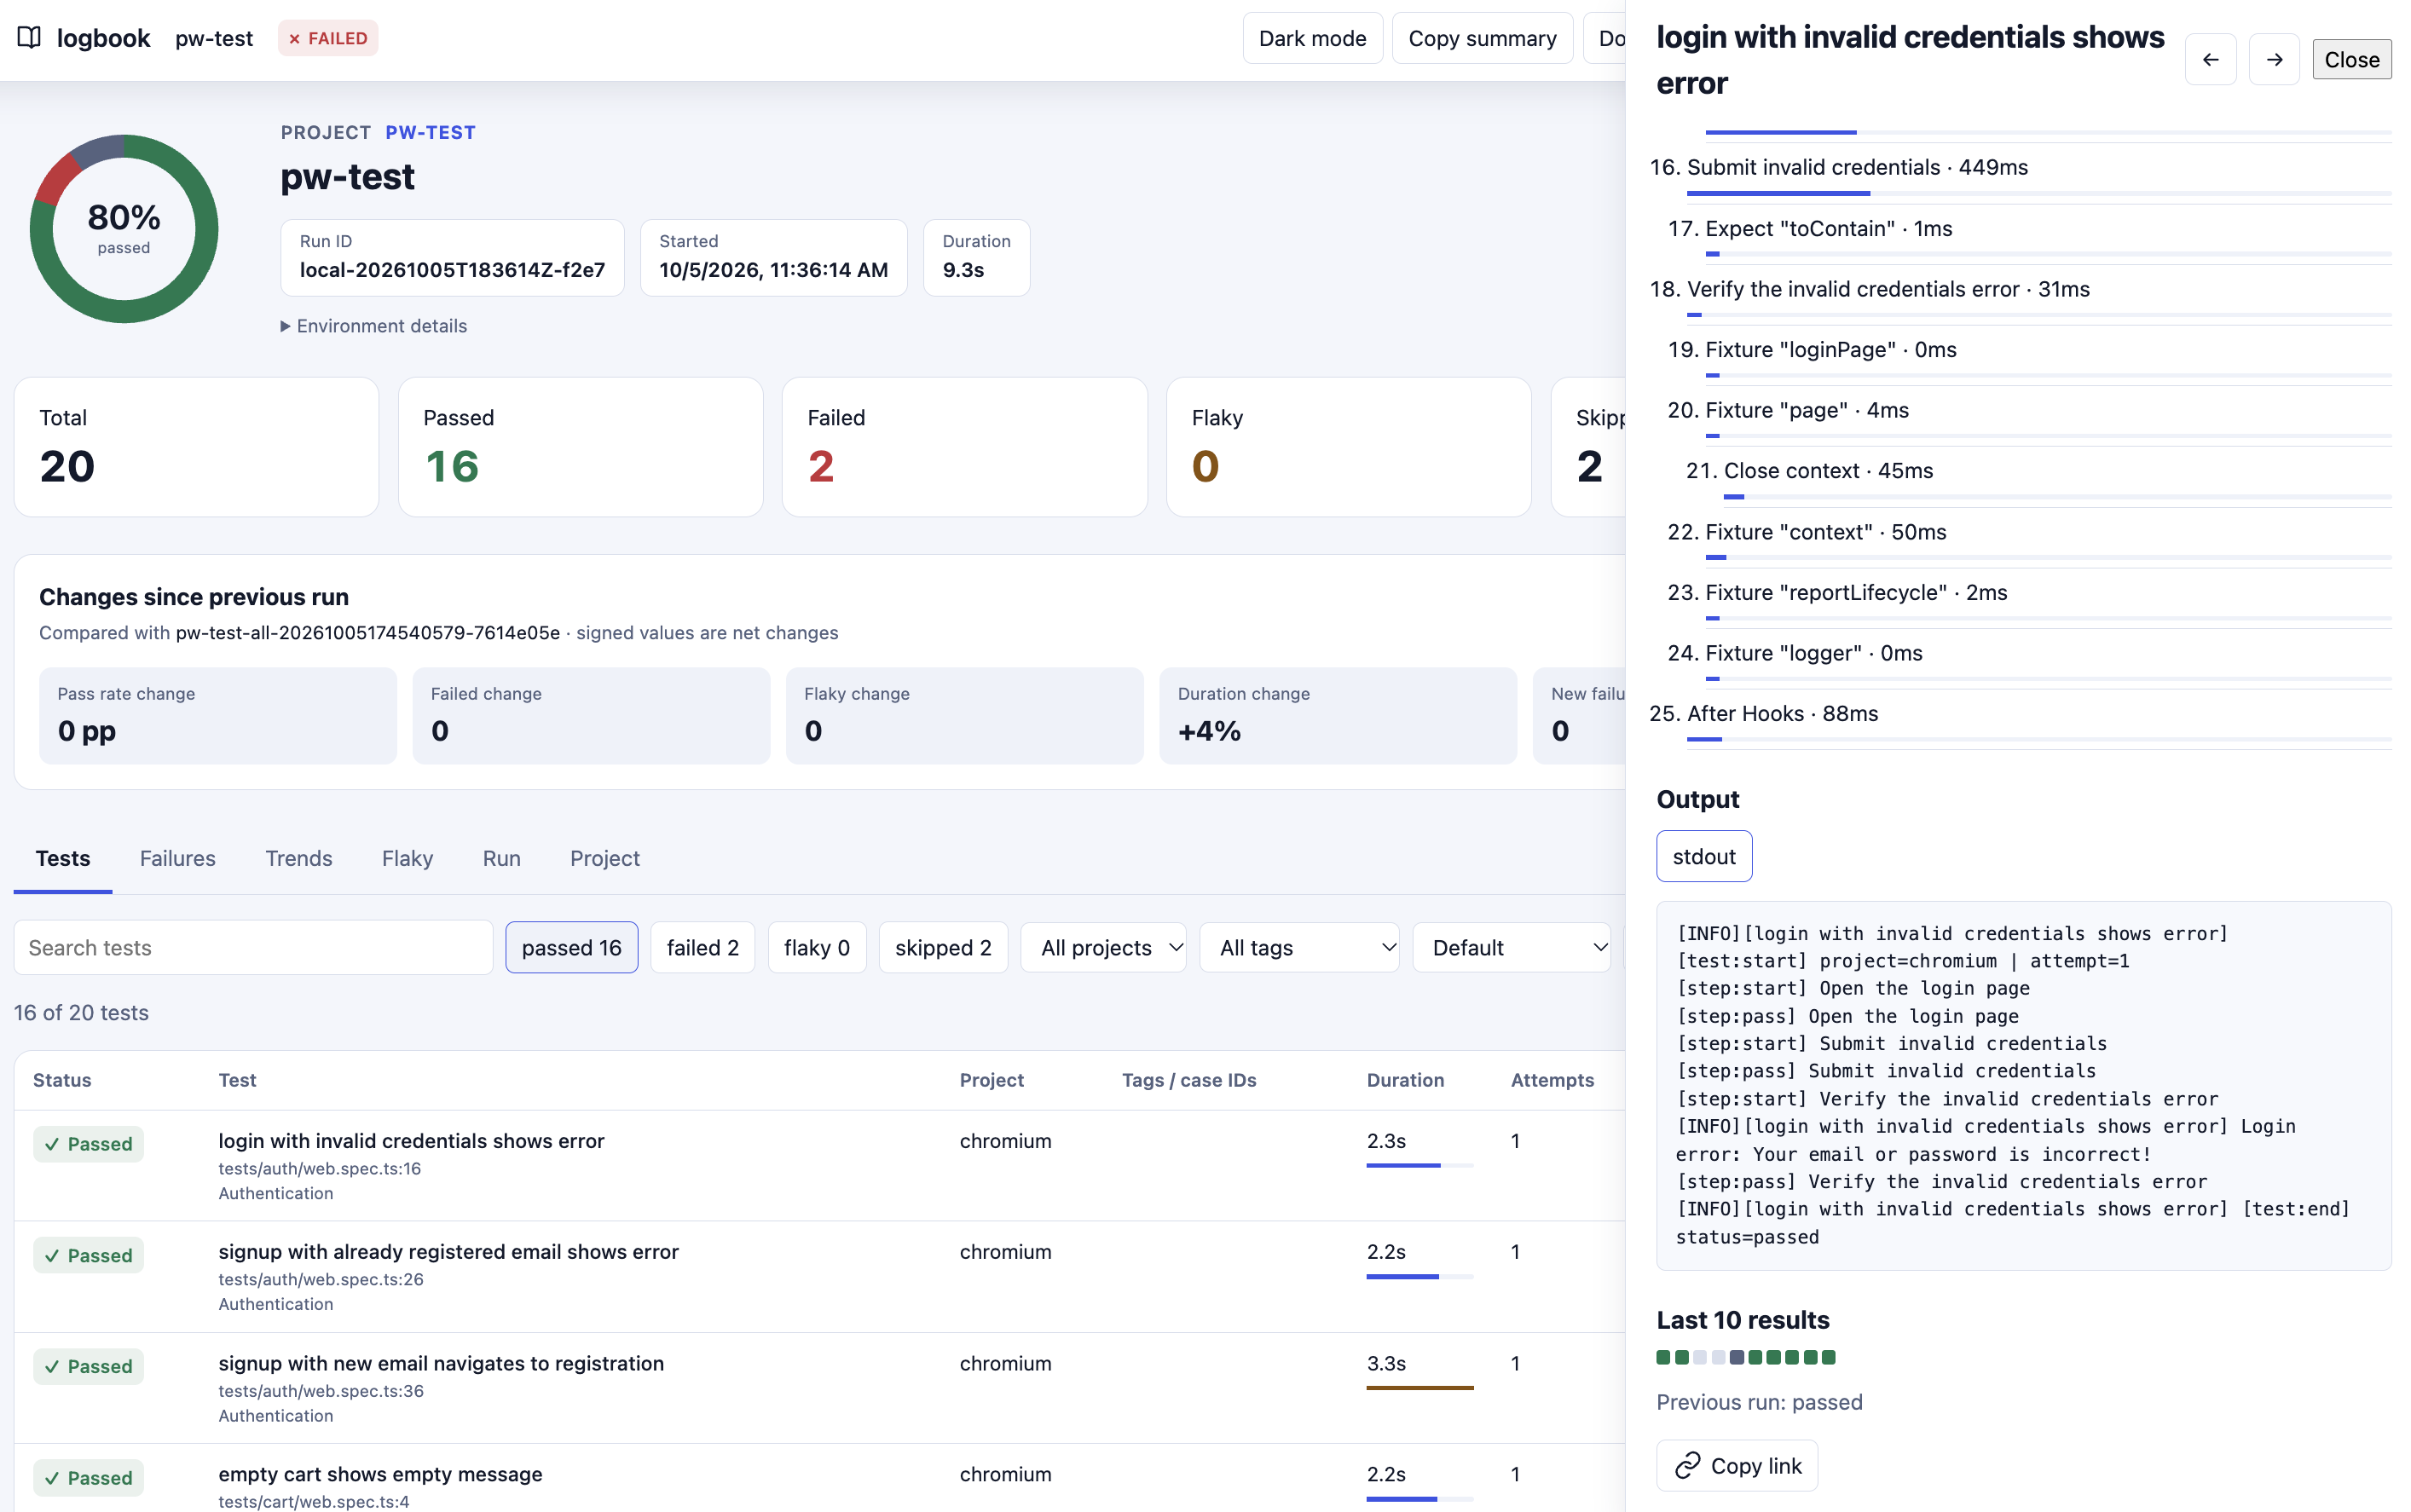
Passed Chromium test opened in the Logbook detail panel with rerun command, debug context and steps
Investigate the exact failure
The Tests view filters by status, project and tag, and groups by file. Open a result for its recorded error, code frame and expandable stack trace. Switch between attempts to see what failed before a retry, with optional captured steps, output and eligible image previews when captureDetails: true was enabled for that run.
Attachments show what was retained. A trace can be opened with Playwright's Trace Viewer through a copied command; Logbook does not embed a trace viewer.
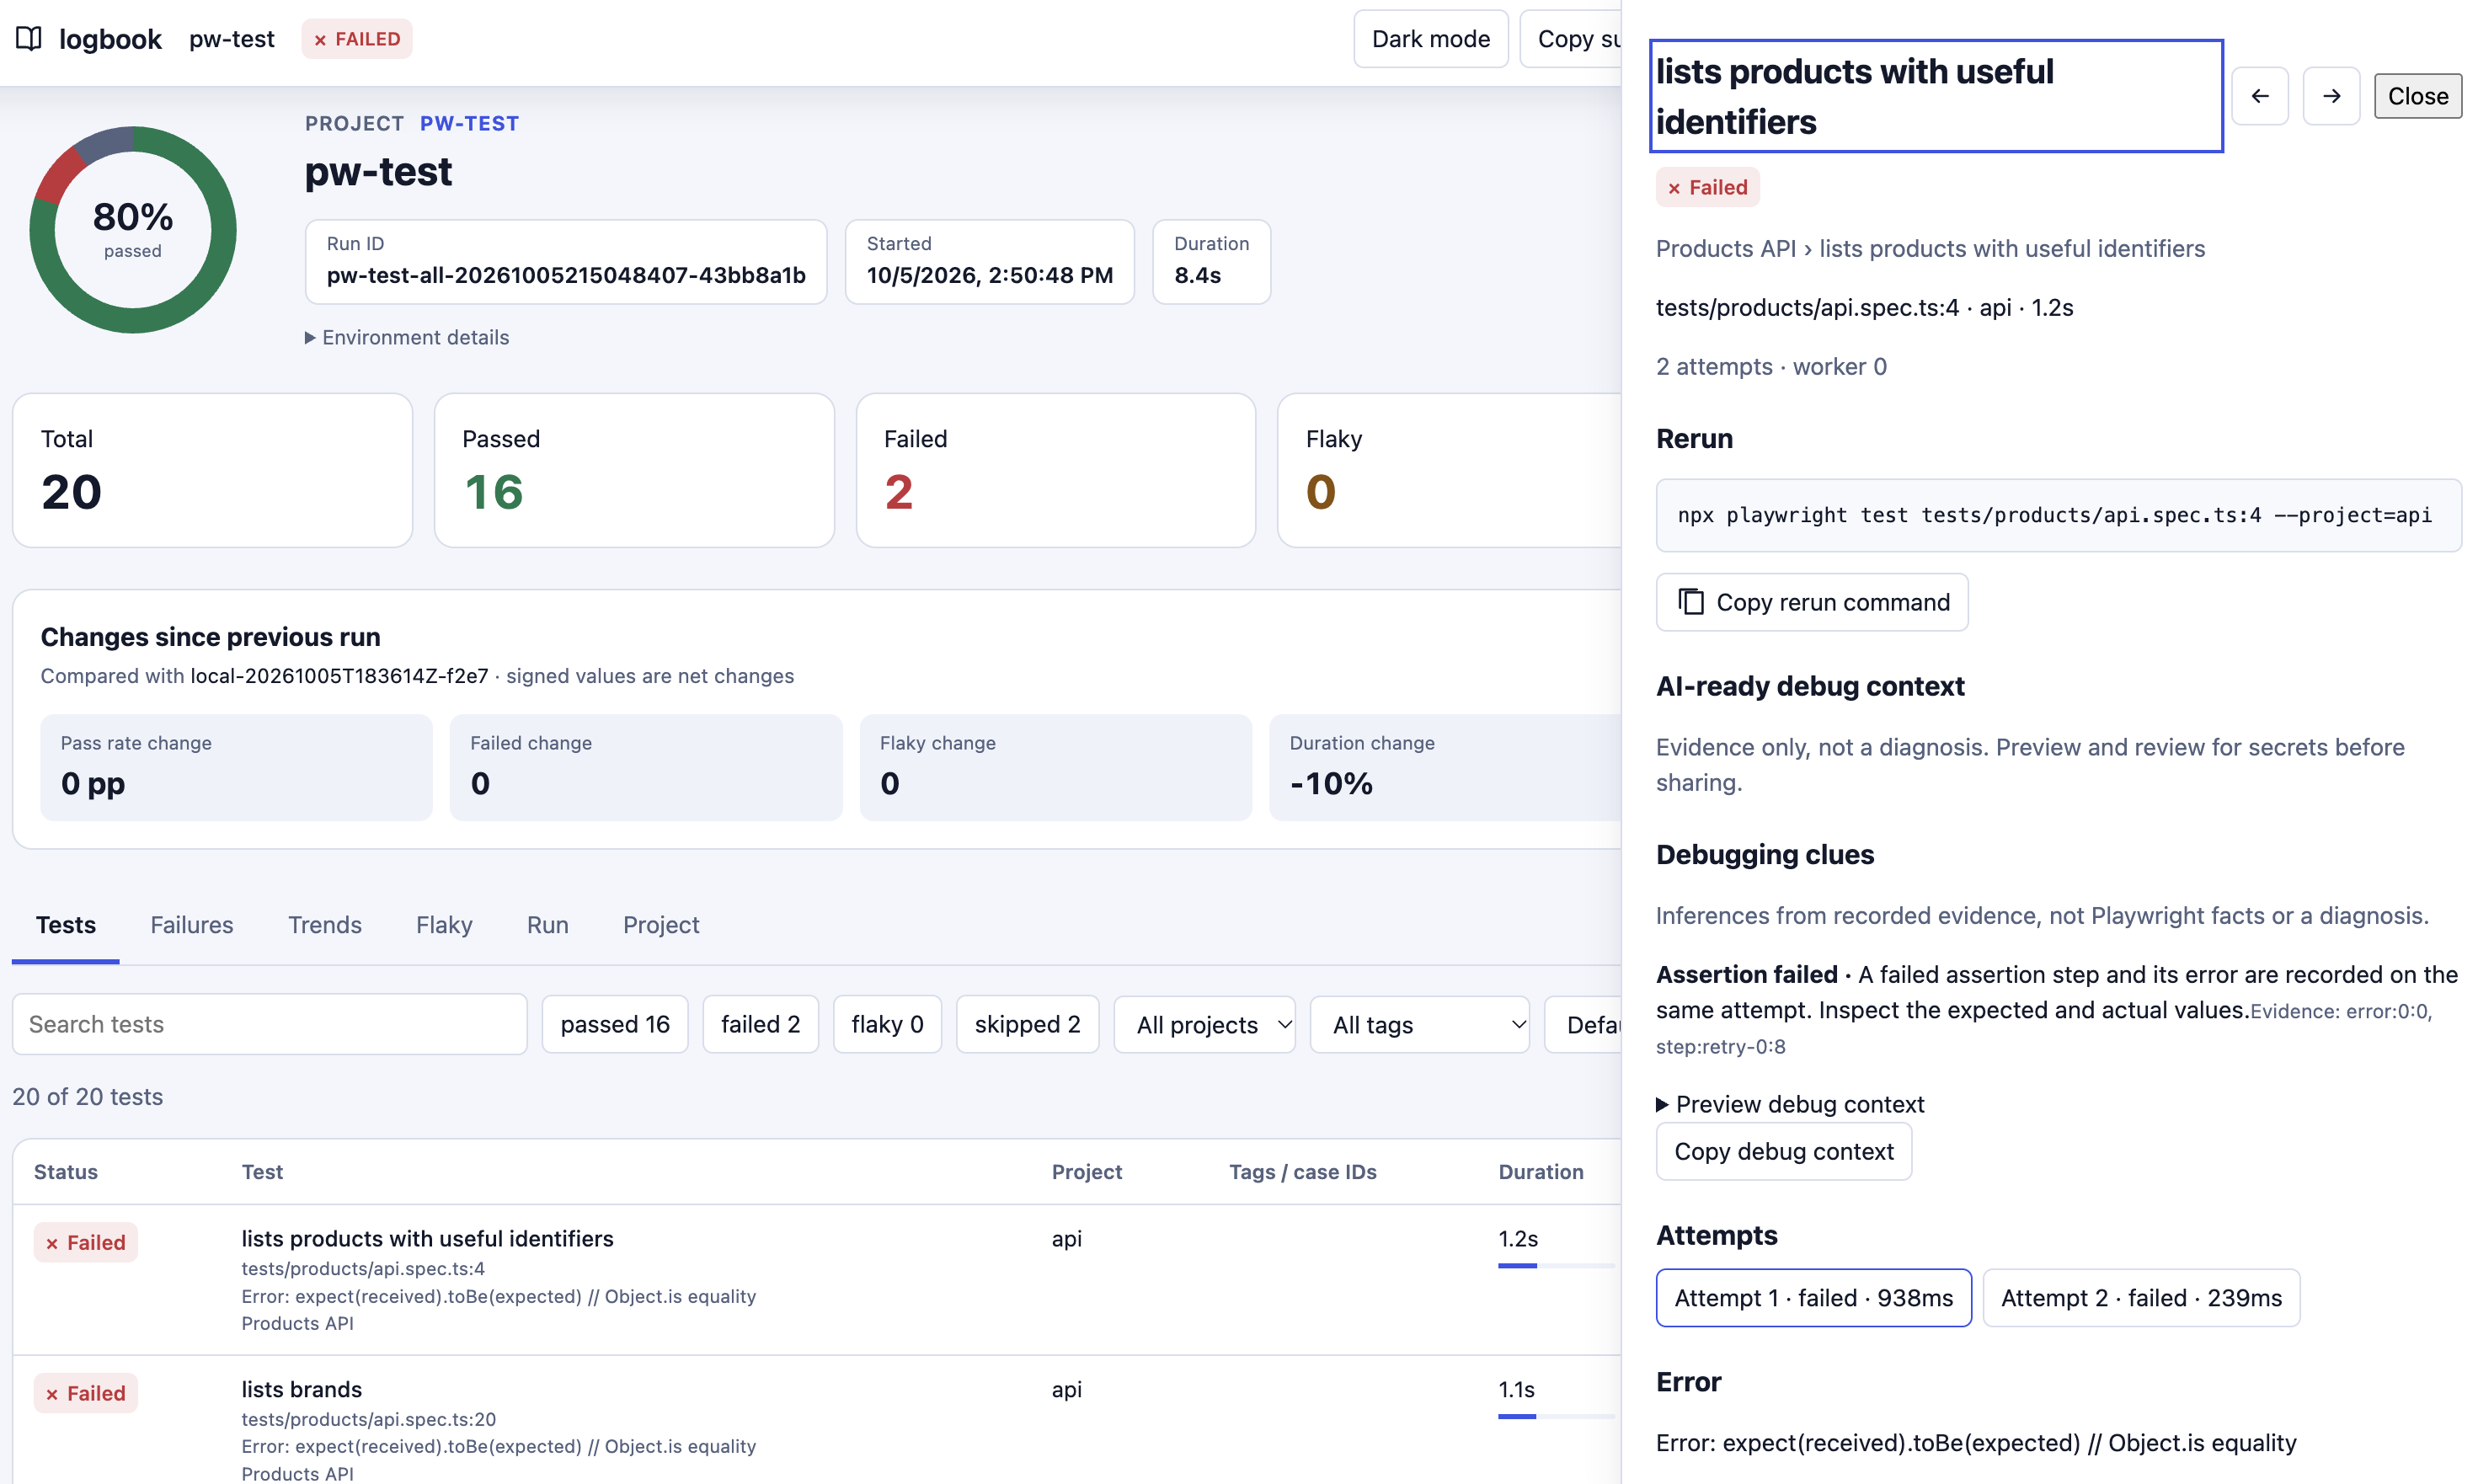
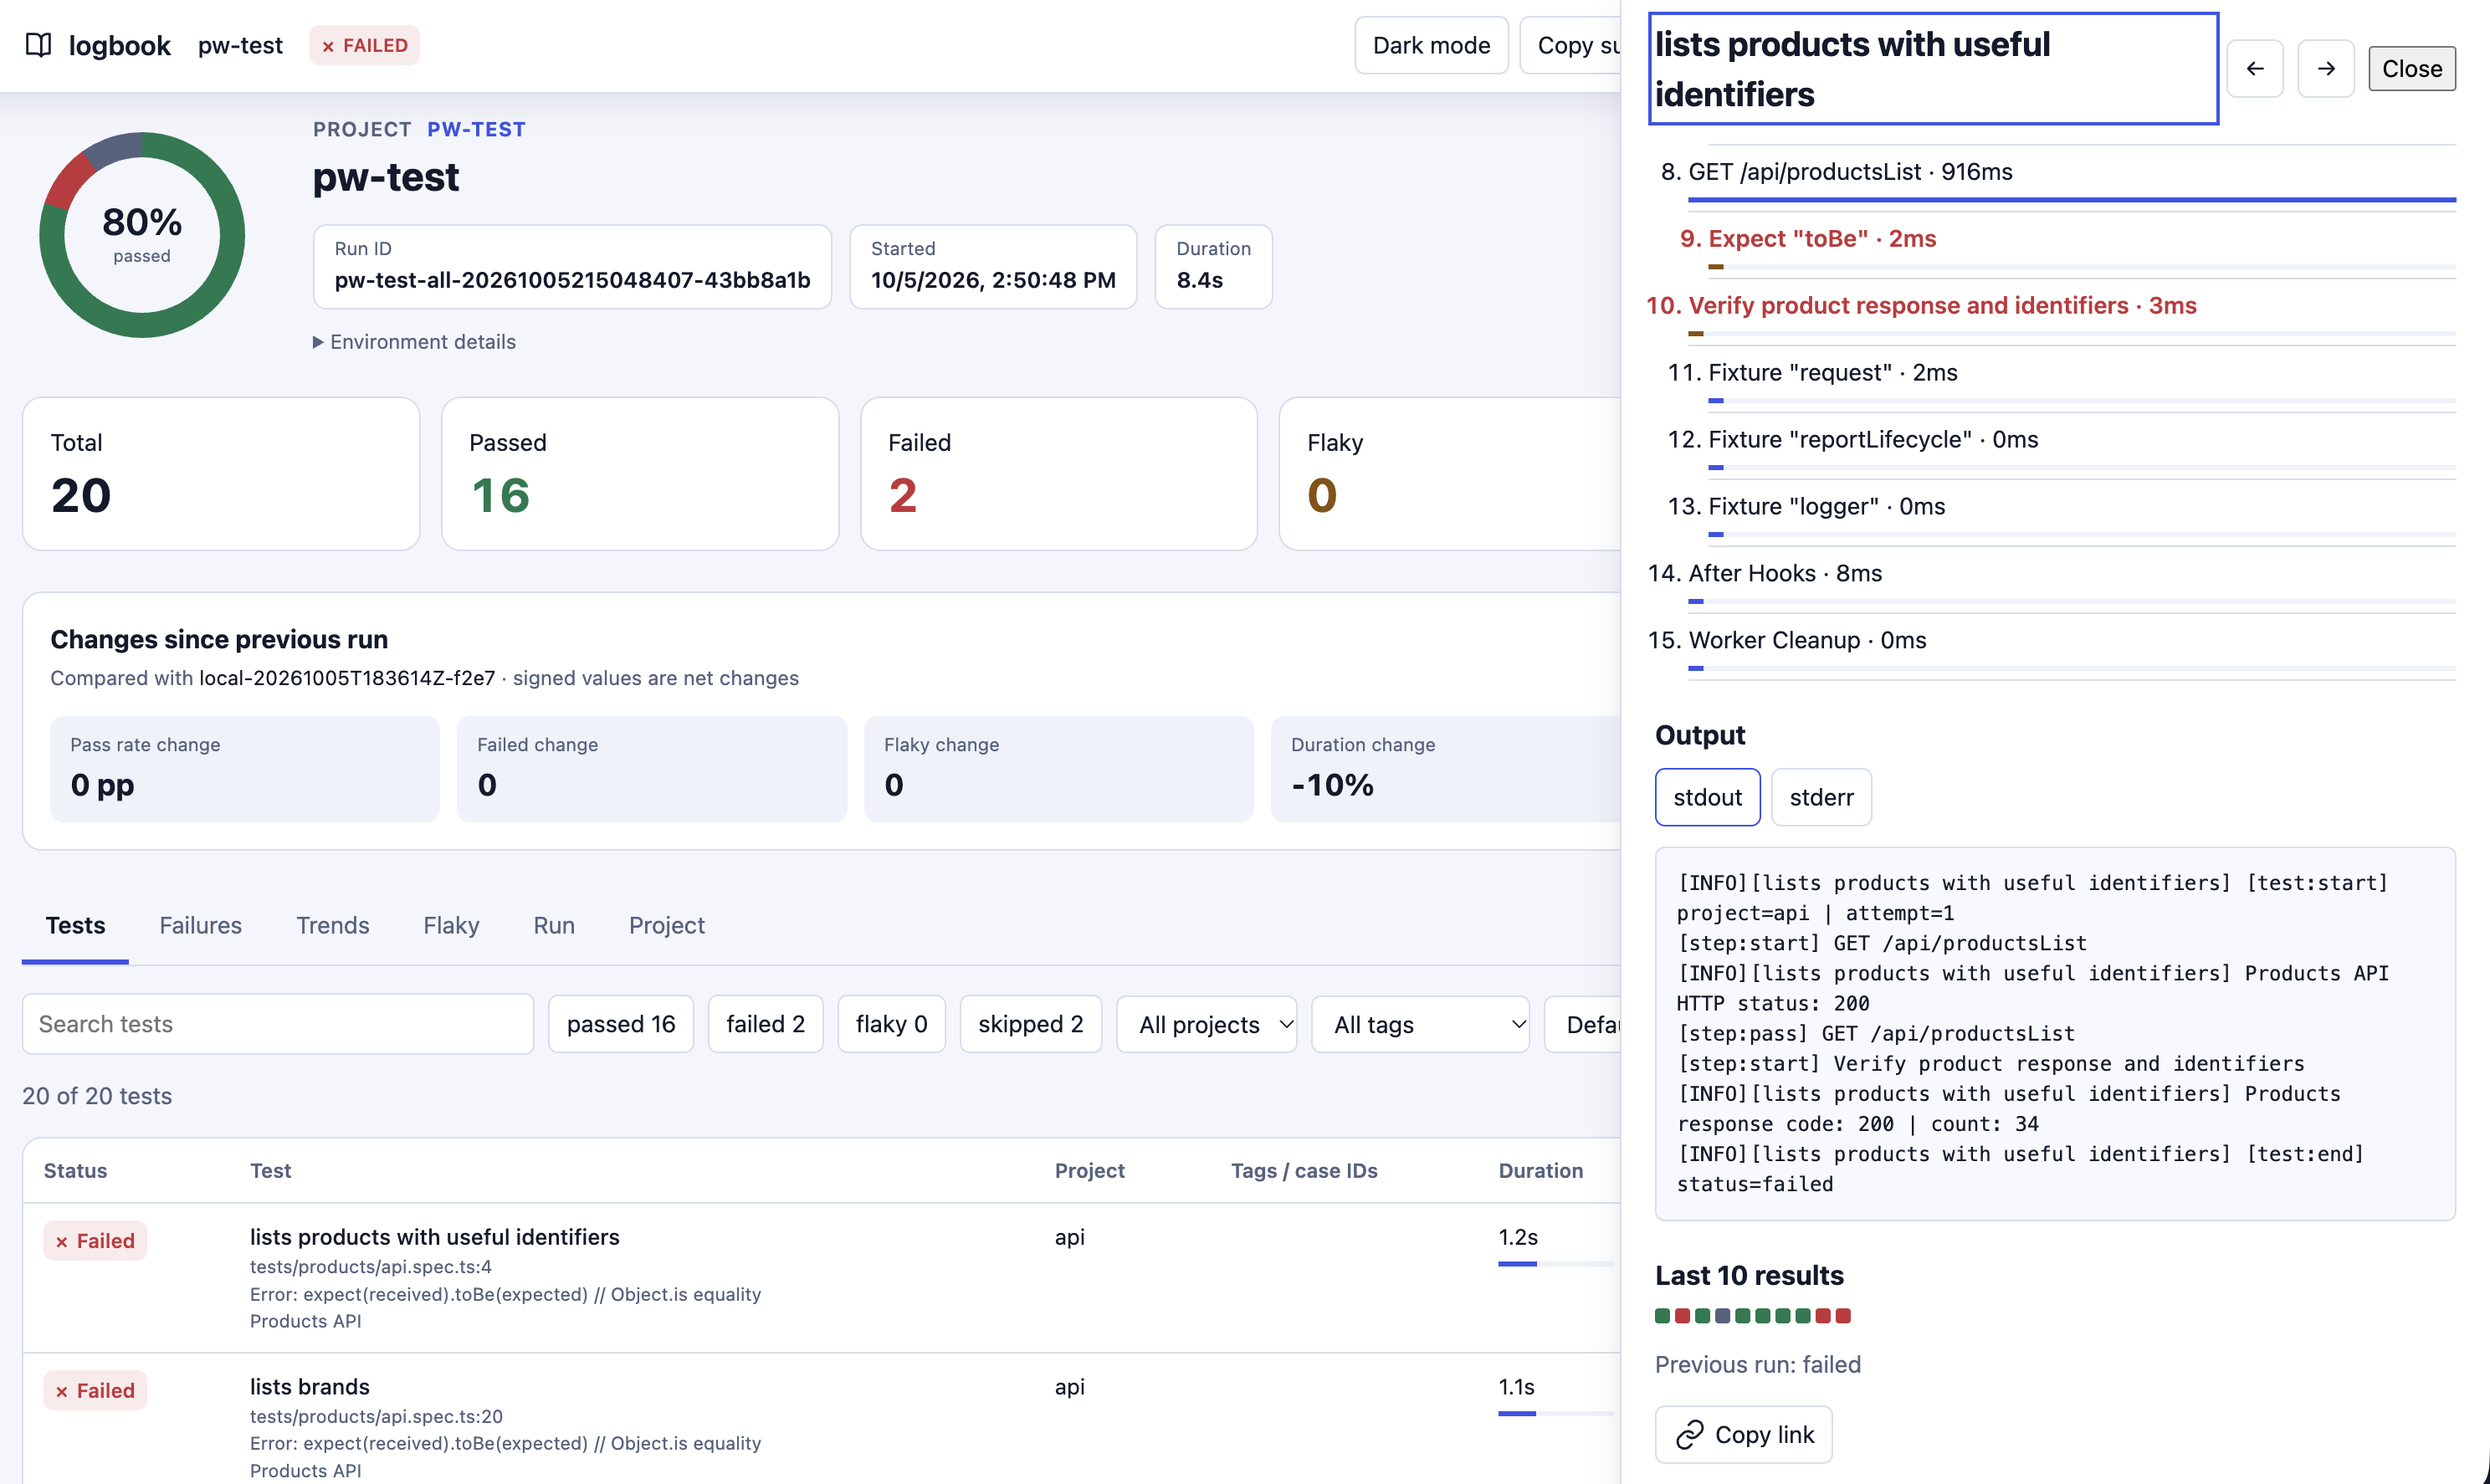
Failed test in the Logbook detail panel with error context, steps and option to switch between attempts.
Triage the run, then look back
The Failures tab groups similar recorded errors. It also identifies new failures, fixed tests, tests still failing, new tests and removed tests relative to the previous saved run. These are triage clues, not a confirmed common cause.
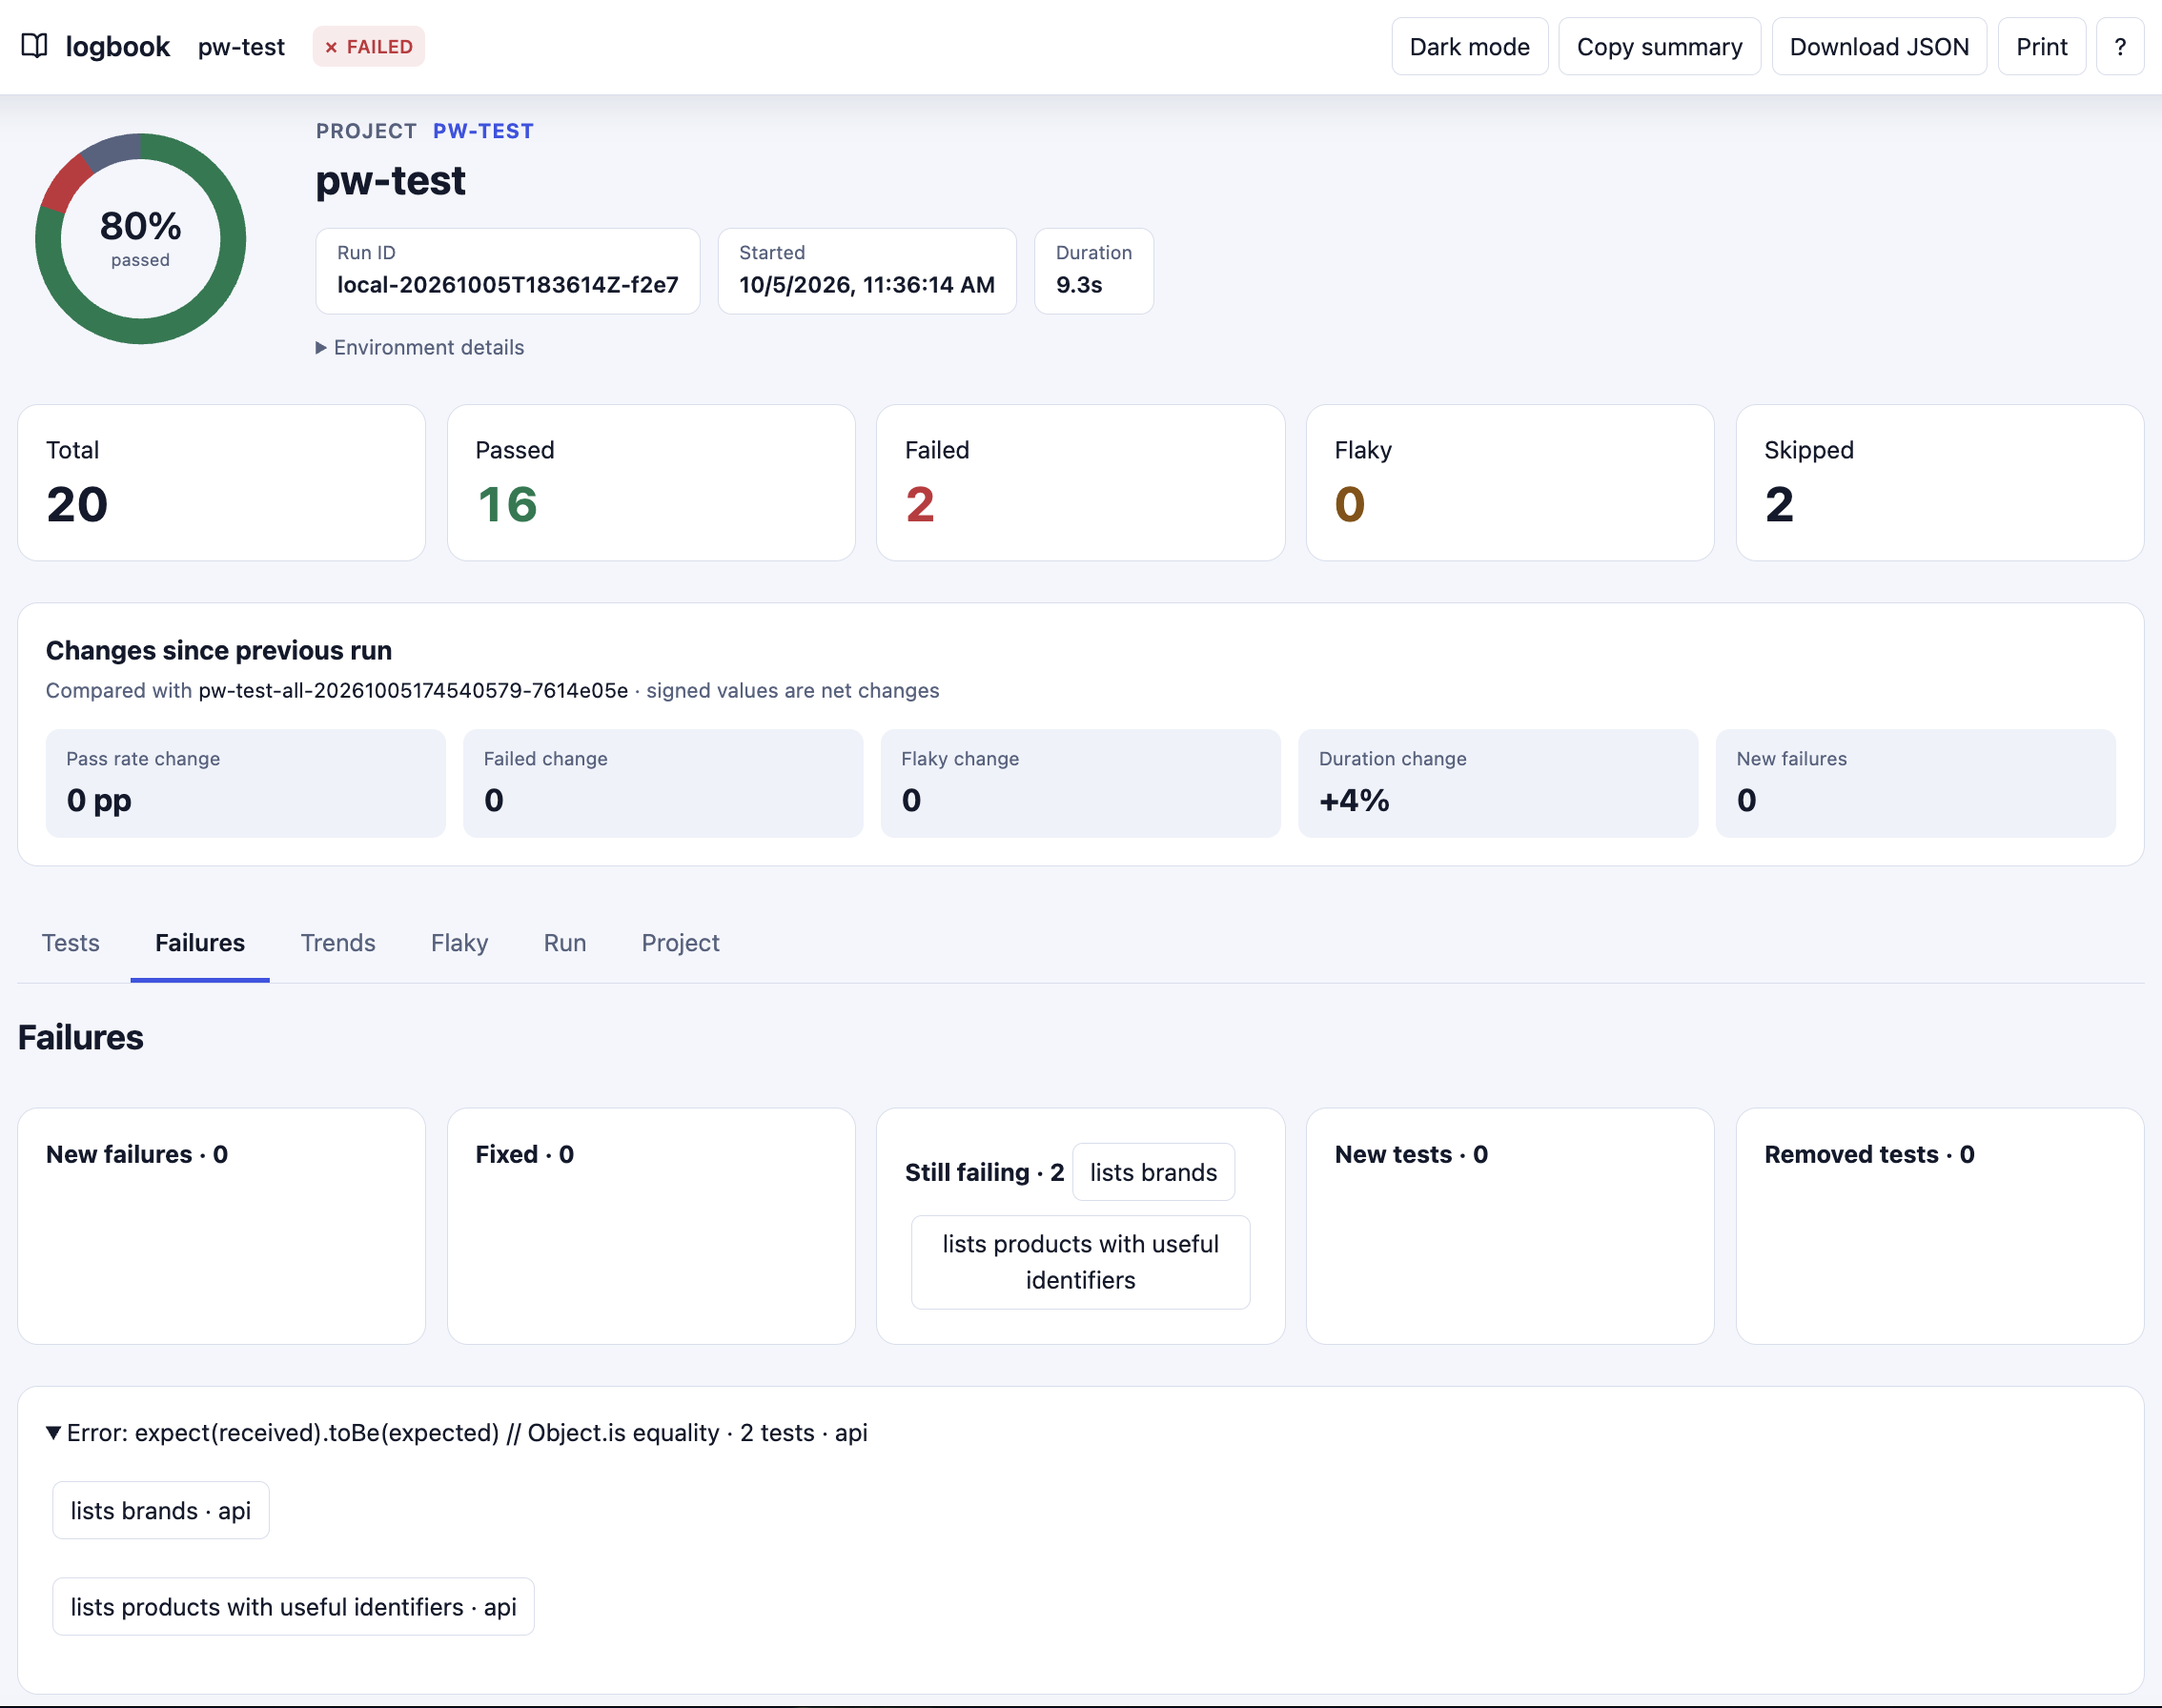
Logbook Failures tab grouping two failing API tests under one error message, with run-change buckets showing two still failing
The Trends view and per-test recent-results strip add context from retained runs. A failure today may be new, recurring or a retry recovery; those lead to different questions. History only reflects executions you kept and cannot establish root cause.
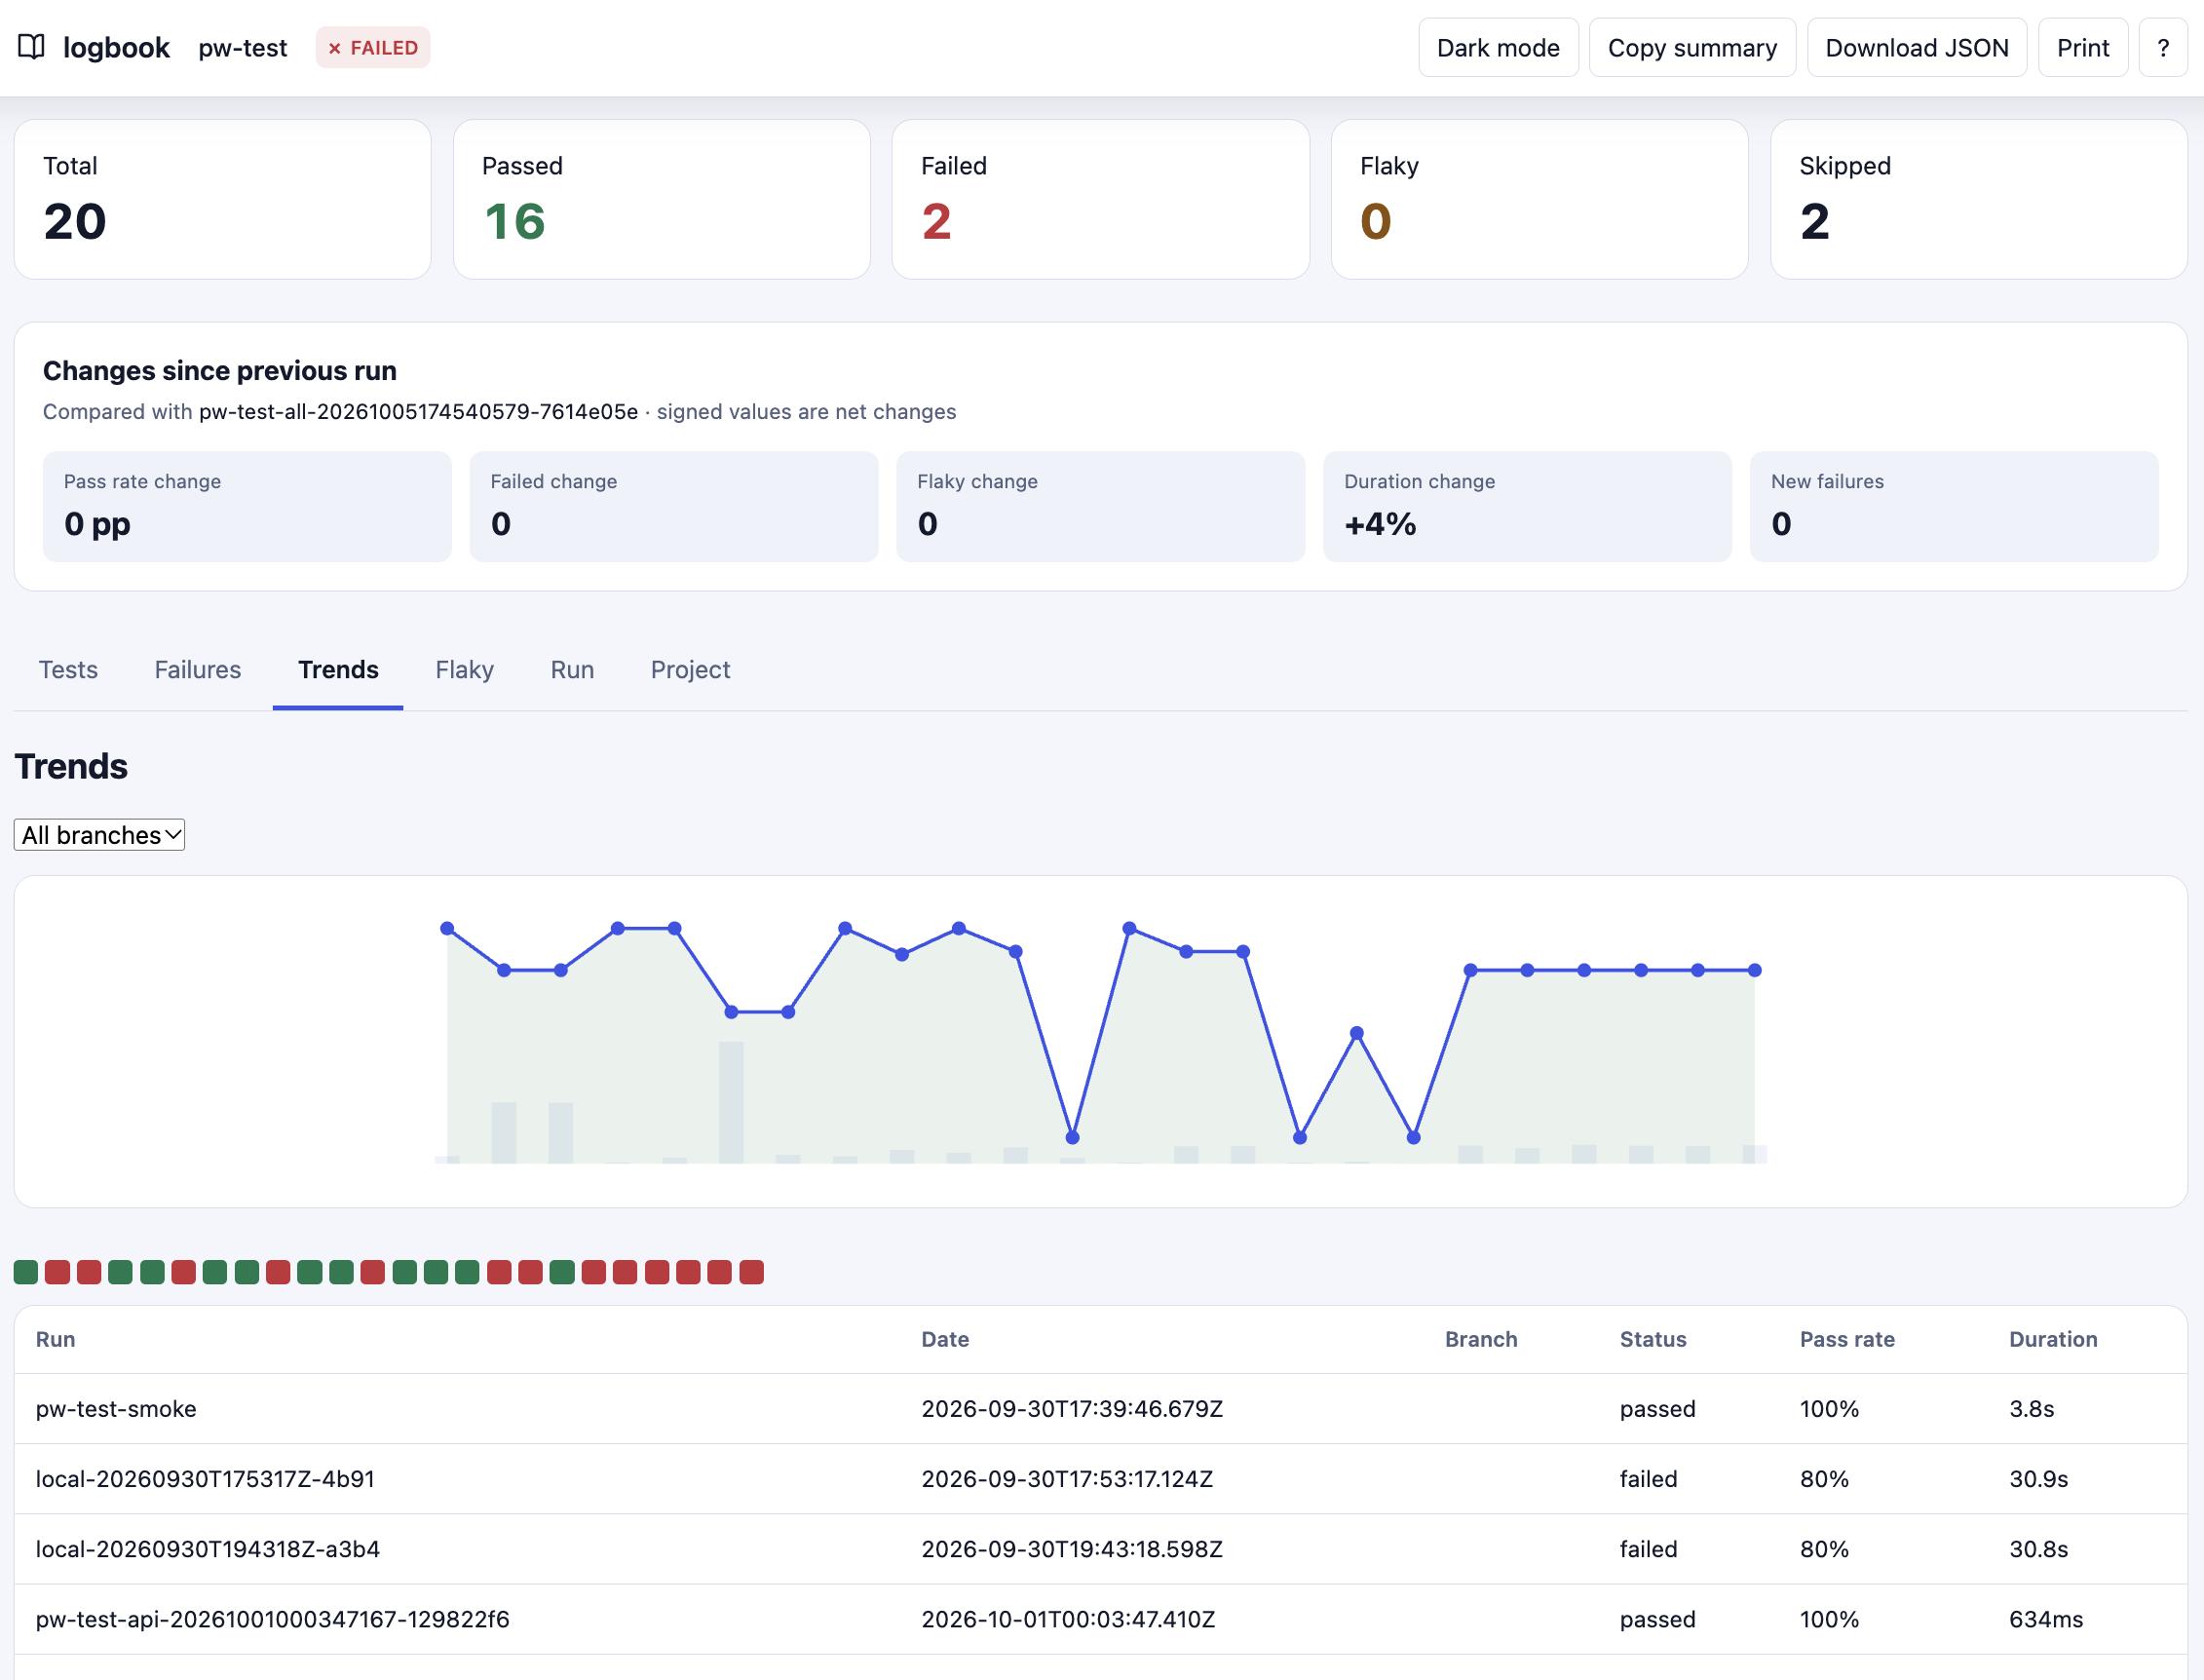
Retained pw-test runs give the trend its context.
The Run tab adds recorded environment details and an approximate worker timeline for unsharded runs when timing data supports it.
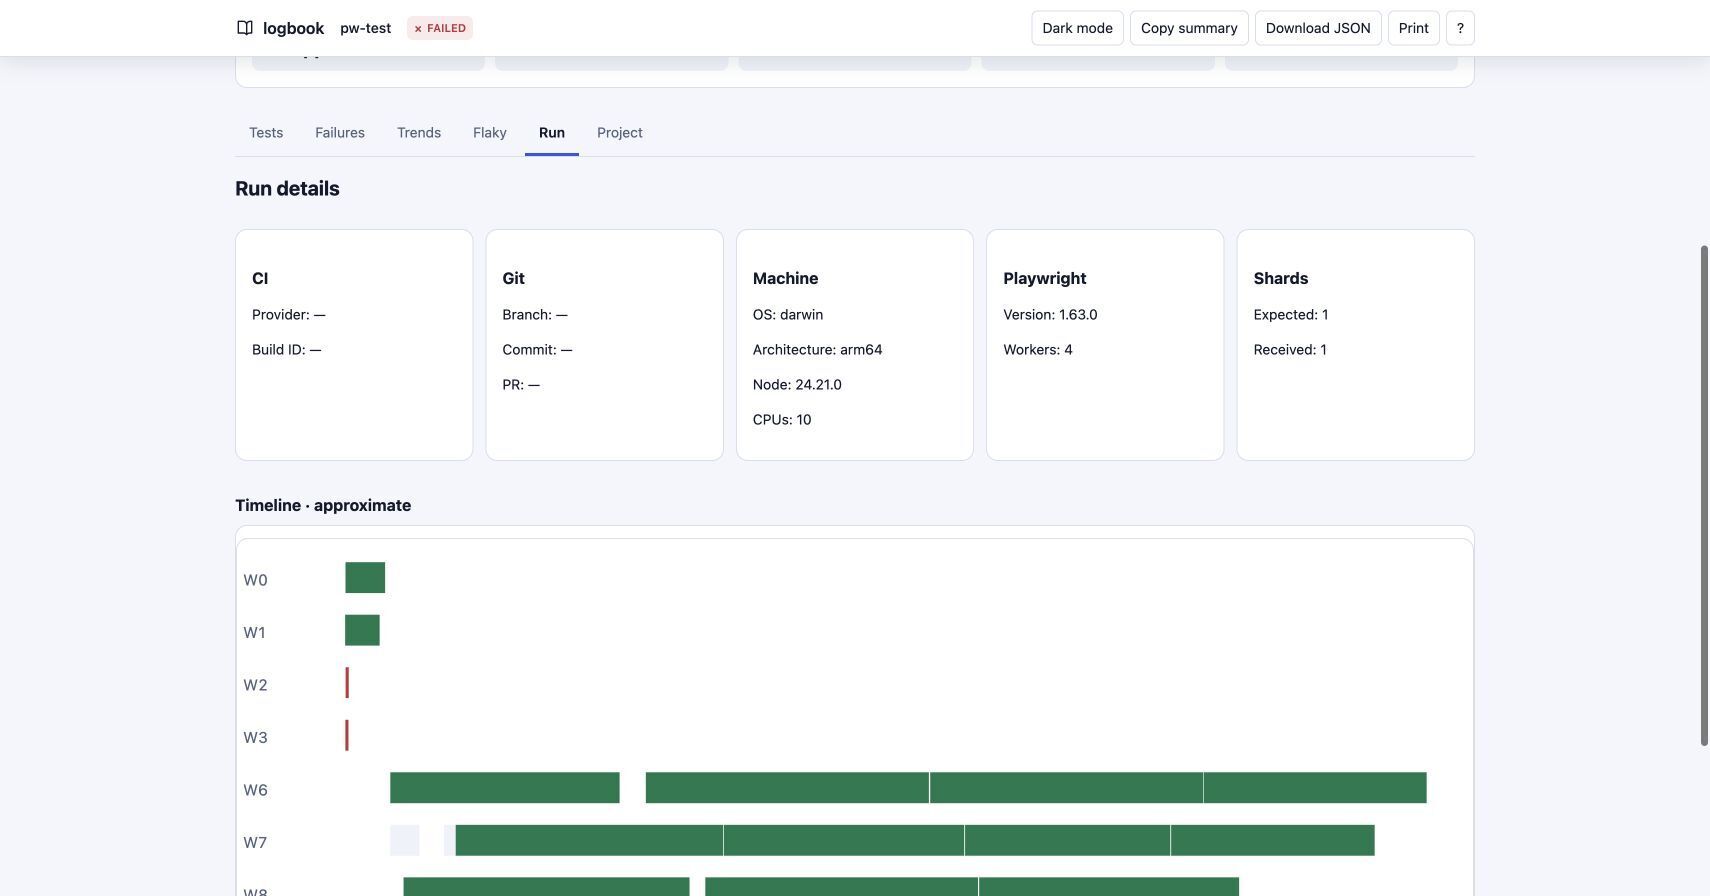
Recorded environment and shard details, with an approximate worker timeline.
The Project tab breaks results down by Playwright project and file.
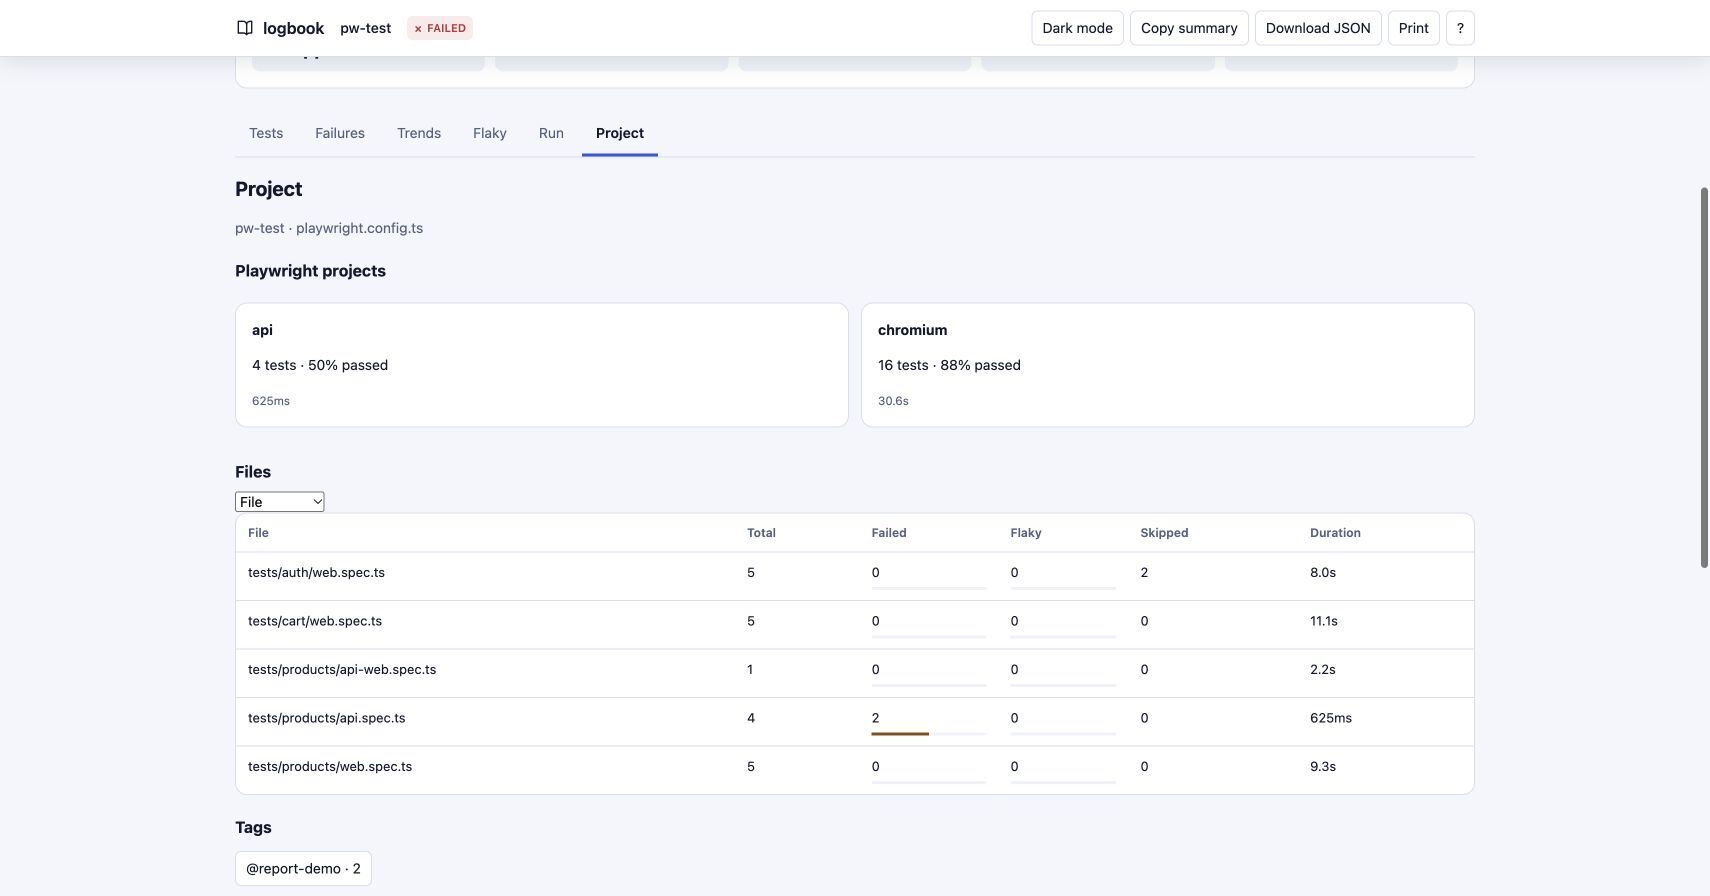
API and Chromium results, followed by the breakdown by test file.
Bring the investigation into your editor
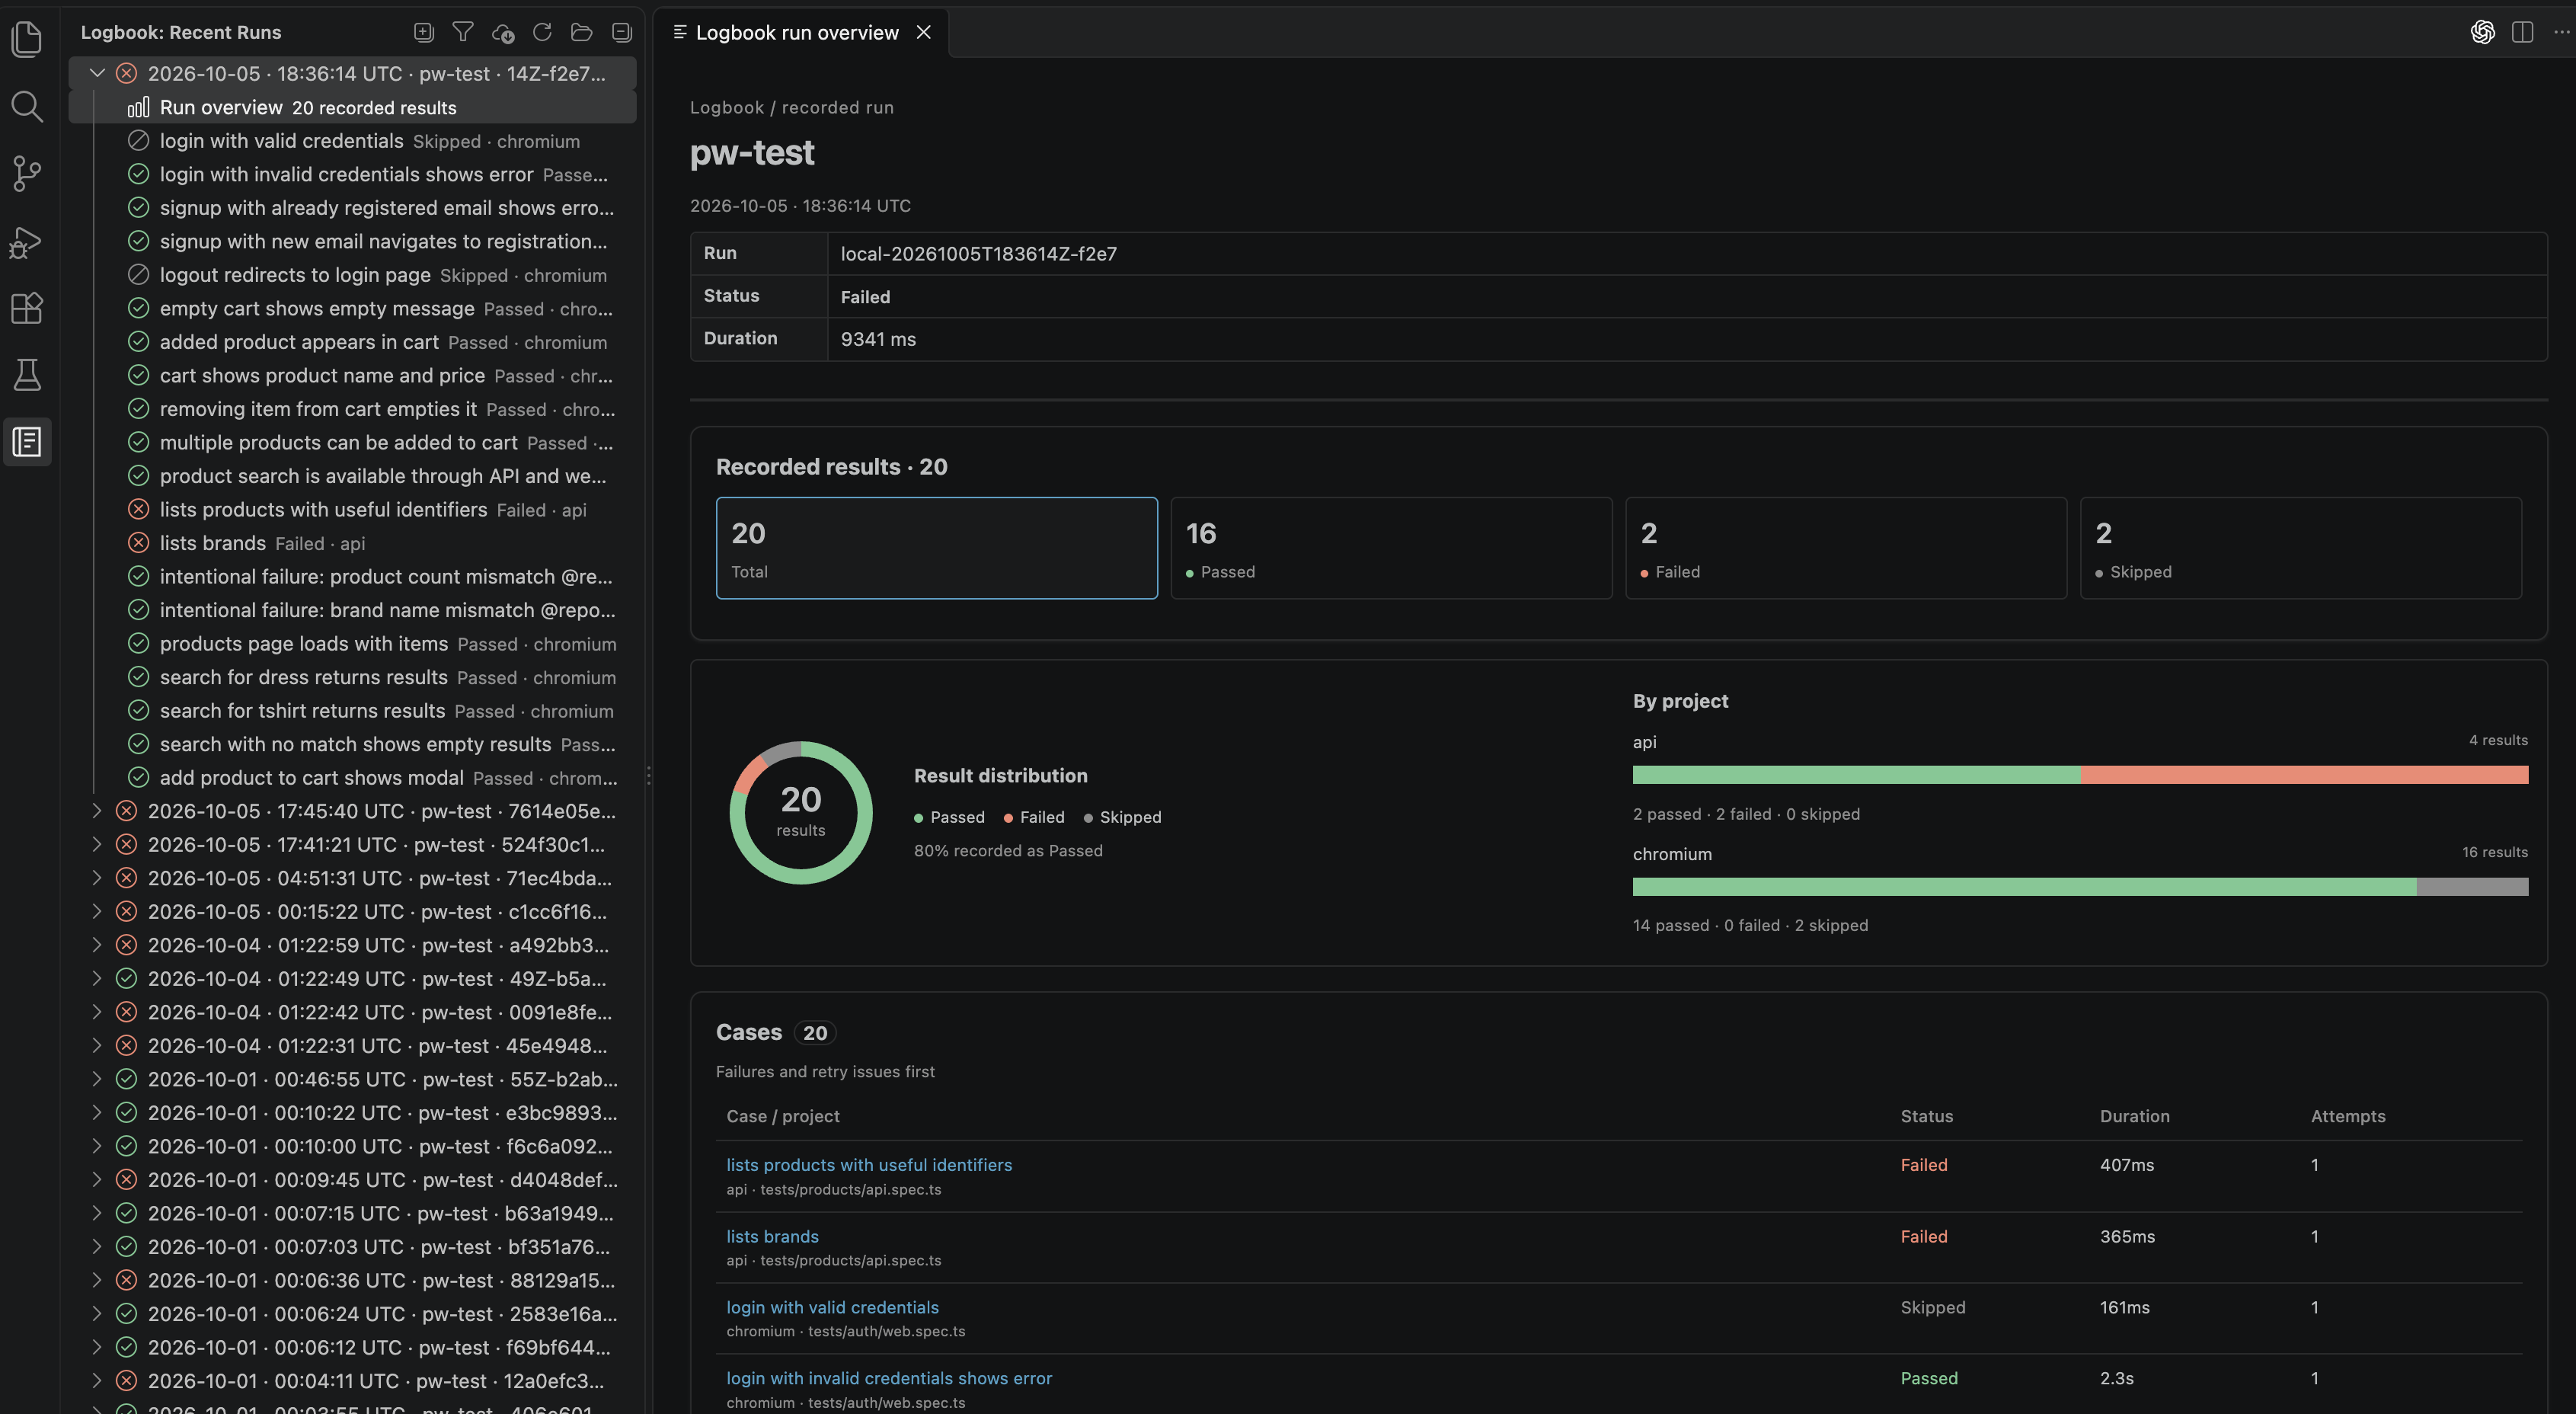
Logbook sidebar and run overview in VS Code, showing saved runs and the cases list
The VS Code companion browses those saved results beside your code: run overview, failure detail, history and recorded source. It also provides execution comparison in its UI. With the CLI, you ask your assistant to compare two debug packets. The reporter remains responsible for collection.
You can also export a portable Logbook bundle from CI, review it and import it into local history. This is a manual workflow, with no automatic CI download. The bundle guide covers project IDs, sharded runs, artifacts and validation.
Try Logbook on a suite you already investigate. Which part would help most: clearer exceptions and attempts, run triage, history, or a better handoff to your coding assistant? Share your thoughts, feature ideas or experience in the comments, or open an issue. If it helps your workflow, a ⭐ on GitHub helps other Playwright users find it.


Top comments (0)