

What can I do to contribute to the current crisis? Often, I found myself repeating this question over and over the past few months. As a recent boot camp grad, I know I wanted to take the skills I learned and contribute to the current crisis the world is facing. One day, I scrolled through GitHub projects that were trending and found that said "COVID-19 Tracker". I wish I can find the original project that I encountered, but it was very simple and easy to read. Sure enough, I found a YouTube tutorial on how to build one. The issue that the project was the line chart was mobile-friendly and the card components were too small in 4k view. I decided I wanted to tackle this project and put my touches on it!
Visual Data
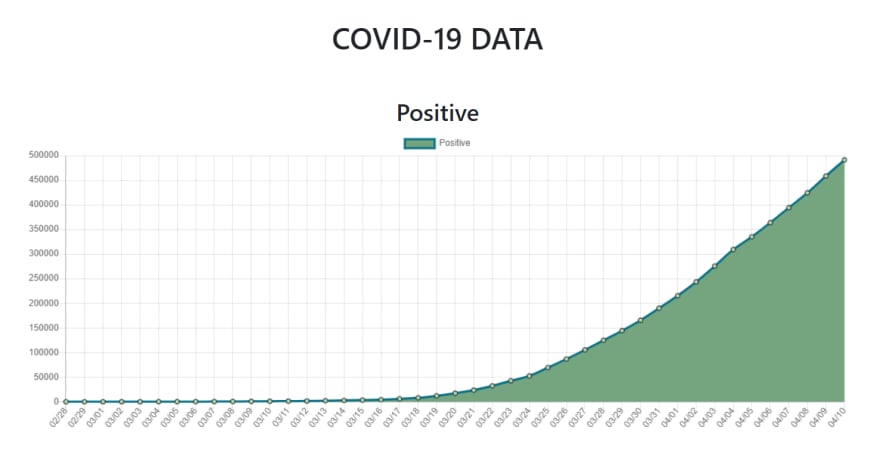
To present the data visually, you will need to learn Chart.js. I found it to be pretty simple and easy to use. The visual data does present nicely, but I had to do a few media queries to optimize it for mobile use. I also used CountUp to add numbers counting up in the card component. I have not used CoutnUp before, but I will be using it for future projects as it is very confident to use.
## Future Updates
I plan on turning the page to be most visually-pleasing. Although this is a really good start, I would love to add a few designs to get the project to stand out for when I present the project to employers. I would also like to add a few more animations to it to add to the user experience of the page.
Github Project
 mrshawnhum
/
covid19-tracker
mrshawnhum
/
covid19-tracker
Covid-19 Tracker with visual chart data both line and bar graphs
Coronavirus Tracker Web Application
LIVE site - https://example-covid-19-tracker.netlify.app

With the unfortunate circumstance, I have decided to develop a web application to track the current cases of the pandemic and provide visual data of the statics. Please feel free to fork this project!
Introduction
This application was developed with create-react-app. To load the page on port:3000, you must use Yarn Start.
API
The API I am utilizing for real-time data - https://covid19.mathdro.id/api
Chart Visualization
I used Chart.js to present the visual data in a line graph and bar graph.
Component layout
I used Material-UI to conveniently design my components. This allows me to focus on the logic of the application as material-ui designs my responsive components
Countup
With visual increasing number format, I have used Countup from react-countup
Check out the project on GitHub! Please leave a star on the project if it has provided any value to you! Feel free to fork the project and put your spin on the project. I am always interested to hear how others had made it better or unique.

Top comments (0)