
Open-source monitoring tool for Node.js applications
1. What is Chronos?
As the complexity of your Node.js applications increase, you need a comprehensive monitoring tool that will give you real-time data of the health and web-traffic of servers, microservices and containers. Chronos does exactly that! It fixes a gap in the market today for availability of a monitoring service within your budget (did I say, it is free?) irrespective of whether you have a monolithic or a microservice architecture, whether you use containers or not, and whether you employ gRPC or REST. Chronos can be setup to receive automated notifications over Slack or email. This flexible monitoring service caters to your needs without having to rewrite the application or having to pay for premium services.
2. How to get started?
Instrument, connect, and go to view metrics, traces and logs.

Instrument your server(s) using the Chronos Tracker.

Connect to your application in the desktop app.

That’s it! You can now view server health metrics, microservices route tracing, and error logs.
For more details, refer to the readme on our Chronos GitHub page.
3. Latest Feature Additions
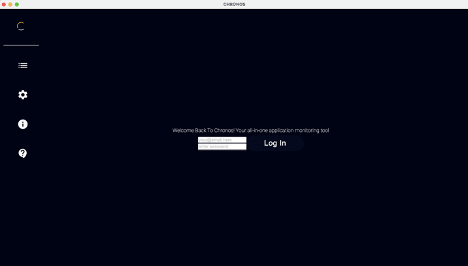
Chronos now comes equipped with user authentication: a login system to ensure only legitimate users get access to your monitoring system. Added security is vital to protect your private information.
Once you are logged in, you can use the new search functionality to quickly access the required database. Note that the databases themselves are already categorized as either Postgres or Mongo, but with the added search feature, you can get to the desired database even quicker instead of manually searching through the list.
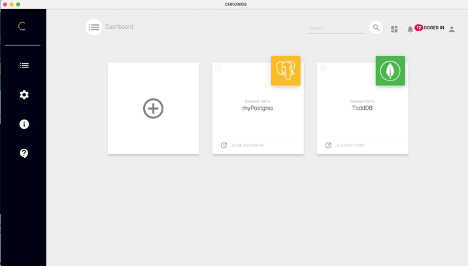
As you add your databases and search through servers for metrics and logs, you will have notifications showing up on the right top corner of the dashboard corresponding to the specific service you just accessed. Not only do the notifications account for every single errored connection but they also update in real time as faulty routes are accessed by some user. Finally, clicking on the notifications removes them from sight, thereby making it easier to move on to the next monitoring task.
Finally, Chronos has been migrated to Node LTS 14.16.1 which is the latest active long-term support release available for general use. This means rolling back to a prior version of Node.js is not necessary for compatibility reasons. Latest LTS ensures that node packages have been updated to the most recent versions and critical security issues have been removed. This new feature successfully extends the application’s life cycle.
4. Other Prominent Features
On fresh download, you will have access to two pre-configured connections showcasing both the dockerized and non-dockerized databases. Dockerized databases will show additional data relating to the container statistics.
Chronos enables live data gathering of servers. This feature includes a Speed Chart, CPU Temperature, Latency, Memory Traces and Process Overview for all servers connected to a Postgres database.

For communications related data, it offers the following metrics to enable a quick overview of the current state of server traffic and request types:

Much more detailed logs of all requests are also accessible within the Electron app.
5. Want to learn more?
For more information please visit our Chronos GitHub page.
Questions or comments? Do not hesitate to reach out:
Nachiket Pingle LinkedIn | Github
Tiffany Graves LinkedIn | Github
Bruno Portela LinkedIn | Github
Danny Martinez LinkedIn | Github
https://www.chronoslany.com/team

Top comments (0)