
The necessity of keeping up with rapidly changing technology is one of the unchanging truths in the field of data analysis. It is necessary for developing insightful conclusions and choosing wisely. The Pandas library for Python has long been a trusted tool for data professionals, providing powerful functionality for data manipulation and analysis. But as technology develops, so are our needs and expectations in the field of data science.
PandasAI is an exciting newcomer in data analysis. It represents a significant leap in our ability to manage, analyze, and derive meaning from large amounts of data.
What is PandasAI? 🤖
PandasAI is a Python library that extends pandas, the popular data analysis and manipulation tool, with Generative AI capabilities. It is intended to be used in conjunction with pandas, not as a replacement for it.
How does PandasAI function?
PandasAI generates Python code using a generative AI model. When you ask PandasAI a question, the model will first attempt to comprehend the query. The Python code to answer the query will then be generated. Finally, the code will be run and the results presented to you.
In this blog post, we will explore a small example, but it will demonstrate a significant impact.
Ready to dive in? Let's get started!
Installing PandasAI:
Installing PandasAI is the first step towards using it.
pip install pandasai
Importing libraries:
from pandasai.llm import OpenAI
from pandasai import SmartDataframe
import numpy as np
import yfinance as yf
In this code chunk, the necessary Python libraries are imported. The code imports the OpenAI and SmartDataframe functions from the pandasai library, indicating its focus on data analysis. Additionally, it imports the numpy library for numerical computations and yfinance for fetching financial data.
OpenAI API setup:
llm = OpenAI(api_token="YOUR_OPENAI_API_KEY") # https://openai.com/
get_log_returns function:
def get_log_returns(ticker, start_date, end_date):
    data = yf.download(
        tickers=ticker,
        start=start_date,
        end=end_date,
        progress=False
    )

    data = data[['Adj Close']].reset_index()
    data['Log_Return'] = np.log(data['Adj Close'] / data['Adj Close'].shift(1))
    data = data.dropna()

    return data
The get_log_returns function is defined here. This function is responsible for retrieving historical stock price data for a specified ticker, between the given start_date and end_date. It uses the yfinance library to download the data, extracts the 'Adj Close' column, calculates logarithmic returns, and returns a DataFrame containing date and logarithmic return values.
Data retrieval:
ticker = 'THYAO.IS'
start_date = '2018-12-31'
end_date = '2023-09-20'
log_returns_data = get_log_returns(ticker, start_date, end_date)
In this code chunk, specific parameters are set for data retrieval. The ticker is set to 'THYAO.IS', which likely represents a stock symbol. The start_date is '2018-12-31', and the end_date is '2023-09-20', indicating the desired time frame. The get_log_returns function is then called to obtain the logarithmic returns data for the specified stock and time frame.
SmartDataframe initialization:
df = SmartDataframe(log_returns_data, config={"llm": llm})
Here, a DataFrame named df is created using the SmartDataframe function from the pandasai library. It is initialized with the obtained log_returns_data. Additionally, a configuration parameter is provided, including the llm instance, indicating that the DataFrame can be used for interactions with the OpenAI language model.
First chat interaction:
df.chat(
    'How many of the logarithmic returns are negative, and how many are positive?'
)
This section initiates a chat interaction with the language model using the df DataFrame. It asks a specific question: "How many of the logarithmic returns are negative, and how many are positive?" This implies that the code utilizes the language model to analyze the financial data and provide answers to questions related to it.
'The number of negative logarithmic returns is 559, and the number of positive logarithmic returns is 593.'
Let's check if the answer is correct!
negative_returns = len(log_returns_data[log_returns_data['Log_Return'] < 0])
positive_returns = len(log_returns_data[log_returns_data['Log_Return'] > 0])

expected_response = f'The number of negative logarithmic returns is {negative_returns}, and the number of positive logarithmic returns is {positive_returns}.'
print(expected_response)
The number of negative logarithmic returns is 559, and the number of positive logarithmic returns is 593.
Spot on!
Second chat interaction:
df.chat(
    "Create a line graph with the title 'THYAO Log Returns', use the 'Date' column on the x-axis, apply the 'fivethirtyeight' theme, and set the figure size to (12,8)"
)

In this section, another chat interaction is initiated, this time requesting the creation of a line graph. The provided instructions specify the graph's title, x-axis data, theme ('fivethirtyeight'), and figure size (12,8). This shows the code's ability to create data visualizations from user queries.
Third chat interaction:
df.chat(
    "Please add 50-day and 200-day moving averages to the closing prices with colors set to orange and red respectively, and set the figure size to (12,8)?"
)
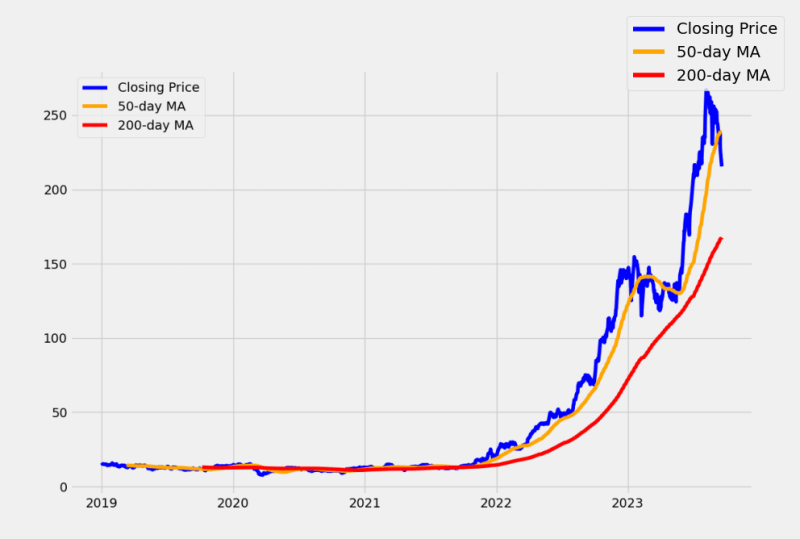
In the last chat above, we requested that it display the 50 and 200 day moving averages based on the closing prices and the colors we desired on the chart.
As a result of seamlessly combining the strength of Generative AI with the well-known capabilities of the Pandas library, PandasAI offers an exciting development in the field of data analysis. For both experts and fans, PandasAI offers up new possibilities with its capacity to analyze queries, produce Python code, and provide meaningful answers.


Top comments (0)