Problem is based off of Mode's SQL Tutorial. Below is the problem:
You show up to work Tuesday morning, September 2, 2014. The head of the Product team walks over to your desk and asks you what you think about the latest activity on the user engagement dashboards. You fire them up, and something immediately jumps out:
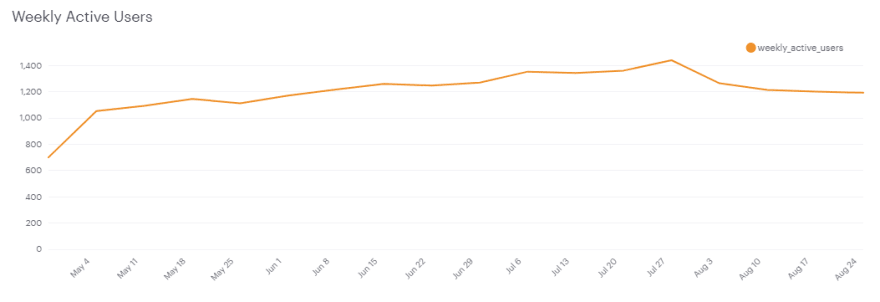
The above chart shows the number of engaged users each week. Yammer defines engagement as having made some type of server call by interacting with the product (shown in the data as events of type "engagement"). Any point in this chart can be interpreted as "the number of users who logged at least one engagement event during the week starting on that date."
You are responsible for determining what caused the dip at the end of the chart shown above and, if appropriate, recommending solutions for the problem.
Brainstorming
Before I begin exploring the data let's start by formulating some hypotheses as to why user engagement could drop, below are a few of mine:
- End of work cycle
- Coordinated Vacation
- Competing platform
- Company testing another app
- Limitations of app discovered
- Novelty wearing off
- Saturation(Marketing isn't spreading the app to new companies the growth becomes "saturated" in the old companies)
Now that we have some ideas independent of the data let's explore the data itself. This will help give us an idea of what questions we can answer as well as indulge our natural curiosity.
yammer_users Table
The first table we have access to is the users table which has the following information:
SELECT *
  FROM tutorial.yammer_users
 LIMIT 5

From this we learn that we have access to unique users, when they first created their account, their company, language of preference, account activation date, and the state of their account
I'm curious how many total users are in the database so I will query that.
SELECT COUNT(*) AS total_user_count
  FROM tutorial.yammer_users

While we are here may as well check what portion of these accounts are activated or pending activation.
SELECT state,
       COUNT(*)*100.0/(SELECT COUNT(*) FROM tutorial.yammer_users) AS user_percentage
  FROM tutorial.yammer_users
 GROUP BY state

Quite a large amount of users are still pending activation of their account. This seems odd so probably worth exploring this more in the future. Questions that come to mind are the following:
- How long have these accounts been pending since their creation?
- Are these accounts spread out across the year or are they localized?
Since I'm a bit surprised about this result I want to delve into this a bit further
SELECT '2014-09-01'::date - created_at::date AS days_pending,
       COUNT(user_id) AS user_count
  FROM tutorial.yammer_users
 WHERE state = 'pending'
 GROUP BY 1
 ORDER BY 1
 LIMIT 5
Here is a visualization of the query:

At this point I would like to know more about what exact conditions are being met by an account being in a pending status. For this exercise I can't do that so I'll just give my best guess. It's likely that out of all the accounts made in a day some portion of them are bots and fail to pass activation. Another possibility are users who created an account but didn't proceed properly for account activation. Over time a database would have a rather large accumulation of these types of pending accounts.
Personally I would prefer if there was an additional state being followed so that a pending account state didn't cover so many possibilities. For example add an additional state 'terminated' for accounts that have been in pending limbo for too long as well as a termination date. This way pending would imply a fresh account awaiting activation as opposed to a graveyard mixed with fresh accounts.
Next I would like to explore the language field to get an idea of the background of people who utilize the app. Specifically looking at active accounts as they would accurately reflect the demographics of people utilizing the app
SELECT language,
       COUNT(user_id)*100/(SELECT COUNT(*) FROM tutorial.yammer_users WHERE state = 'active') AS user_percentage
  FROM tutorial.yammer_users
 WHERE state = 'active'
 GROUP BY 1
 ORDER BY 1

Lastly I would like to get an idea of both the number of companies these users are from as well as how many users per company.
SELECT COUNT(DISTINCT company_id) AS company_count
  FROM tutorial.yammer_users
 WHERE state = 'active'

SELECT sub.employee_cohorts,
       COUNT(sub.company_id) AS company_count
       FROM(
            SELECT company_id,
                   CASE WHEN COUNT(user_id) = 1 THEN '1 Employee'
                        WHEN COUNT(user_id) > 1 AND COUNT(user_id) <= 10 THEN '2-10 Employees'
                        WHEN COUNT(user_id) > 10 AND COUNT(user_id) <= 20 THEN '11-20 Employees'
                        WHEN COUNT(user_id) > 20 AND COUNT(user_id) <= 30 THEN '21-30 Employees'
                        WHEN COUNT(user_id) > 30 AND COUNT(user_id) <= 40 THEN '31-40 Employees'
                        WHEN COUNT(user_id) > 40 AND COUNT(user_id) <= 50 THEN '41-50 Employees'
                        ELSE '51+ Employess' END AS employee_cohorts
              FROM tutorial.yammer_users
             WHERE state = 'active'
             GROUP BY company_id
 ) sub
 GROUP BY sub.employee_cohorts
 ORDER BY COUNT(sub.company_id) DESC

Yammer is designed to be a social networking app for communicating with coworkers so it's odd to see that so many of the active users are from companies with only one active user. If I had no one to work with on the app what is the point of even being on the app? In the future it will probably be useful to do queries where we specifically target companies with only one user versus multiple users.
yammer_events Table
Starting with a broad look of the table
SELECT *
  FROM tutorial.yammer_events
 LIMIT 5

Overall this table has some interesting new data to play with. I'm specifically interested in the device, event_name, and event_type columns.
SELECT event_name,
       COUNT(*) AS event_count
  FROM tutorial.yammer_events
 GROUP BY event_name
 ORDER BY event_count DESC

In retrospect I'd prefer to look at this as a percentage
SELECT event_name,
       COUNT(*)*100.0/(SELECT COUNT(*) FROM tutorial.yammer_events) AS event_percentage
  FROM tutorial.yammer_events
 GROUP BY event_name
 ORDER BY event_percentage DESC

From this query we can see that a majority of the user engagements are from interactions with home_page, like_message, view_inbox, login, and send_message
Earlier we discovered that a large portion of the user base are actually the only user in a company. I'm a little curious as to how their engagements differ so we'll do a query to explore that now.
SELECT e.event_name,
       COUNT(e.user_id)*100.0/(SELECT COUNT(*)
                               FROM tutorial.yammer_events e
                               JOIN ( SELECT main.user_id
                                        FROM tutorial.yammer_users main
                                        JOIN(   SELECT company_id,
                                                       CASE WHEN COUNT(user_id) = 1 THEN '1 Employee'
                                                            ELSE '2+ Employees' END AS employee_cohorts
                                                  FROM tutorial.yammer_users
                                                 WHERE state = 'active'
                                                 GROUP BY company_id
                                                HAVING CASE WHEN COUNT(user_id) = 1 THEN '1 Employee'
                                                            ELSE '2+ Employees' END = '1 Employee'
                                            ) sub
                                          ON sub.company_id = main.company_id
                                    ) subf
                                  ON e.user_id = subf.user_id) AS event_percentage
  FROM tutorial.yammer_events e
  JOIN ( SELECT main.user_id
           FROM tutorial.yammer_users main
           JOIN(   SELECT company_id,
                          CASE WHEN COUNT(user_id) = 1 THEN '1 Employee'
                               ELSE '2+ Employees' END AS employee_cohorts
                     FROM tutorial.yammer_users
                    WHERE state = 'active'
                    GROUP BY company_id
                   HAVING CASE WHEN COUNT(user_id) = 1 THEN '1 Employee'
                               ELSE '2+ Employees' END = '1 Employee'
              ) sub
             ON sub.company_id = main.company_id
        ) subf
    ON e.user_id = subf.user_id
 GROUP BY event_name
 ORDER BY event_percentage DESC

This is a big query but the overall logic is similar to the engagements query from earlier. First I extract the companies with only 1 user in a query. Downside is by doing this I just lost the user_id information which is necessary to join with the engagements table. To regain user_id information I join the previous query with the main table on company_id. I now have a table of user_id that only belong to one company. Using this table I can now join it with the engagements table and display information pertaining only to users who are the only person in their company using the application. I still want to display this information as a percentage so I need to replicate everything I just did but instead count all the users together.
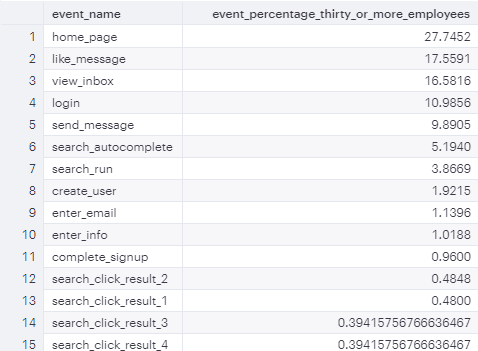
I intentionally designed the query so that I could also check companies with more than one user as well by changing a few conditions. The table for this query's output is below.

Surprisingly the difference between the two populations isn't that much. Possible explanation could be that a large portion of the 2+ employee sections is companies with 2-10 employees which isn't that much larger than 1. Maybe the difference in engagement between 1 employee and 2-10 isn't that much. Can quickly check this by altering 2+ employees companies to be 30+ instead
Again the results aren't too different. Looks like this may be a dead end for now. On to the next column
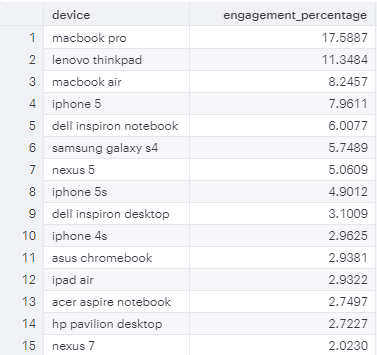
SELECT device,
       COUNT(*)*100.0/(SELECT COUNT(*) FROM tutorial.yammer_events) AS engagement_percentage
  FROM tutorial.yammer_events
 GROUP BY device
 ORDER BY engagement_percentage DESC
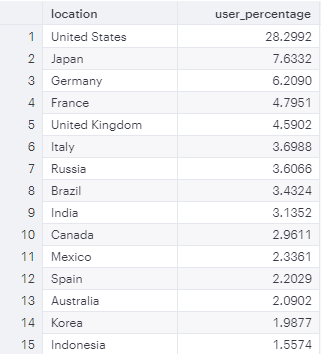
Following query is similar to our language query from earlier but instead we are using location data
SELECT location,
       COUNT(DISTINCT user_id)*100.0/(SELECT COUNT(DISTINCT user_id) FROM tutorial.yammer_events) AS user_percentage
  FROM tutorial.yammer_events
 GROUP BY location
 ORDER BY user_percentage DESC
Next query is to see what are the unique values for event_type.
SELECT DISTINCT event_type
  FROM tutorial.yammer_events

Overall this table will be useful in our analysis since we are exploring a drop in user engagement. There is still one column that I haven't explored quite yet, the user_type column. Main reason for this is that the data is numerical and I don't have a way to associate the numbers to a descriptive state. Without a descriptive state I can't really interpret the significance of a user having user_type = 3 or 2.
yammer_emails Table
By now you know the drill. Let's see the entire table.
SELECT *
  FROM tutorial.yammer_emails
 LIMIT 5

For this table it looks like the only column we need to explore is action
SELECT action,
       COUNT(*)*100.0/(SELECT COUNT(*) FROM tutorial.yammer_emails) AS email_percentage
  FROM tutorial.yammer_emails
 GROUP BY action
 ORDER BY email_percentage DESC

Hypothesis Development Round Two
That should be it for exploring the data, let's return back to my initial hypotheses.
- End of work cycle
- Coordinated Vacation
- Competing platform
- Company testing another app
- Limitations of app discovered
- Novelty wearing off
- Saturation(Marketing isn't spreading the app to new companies the growth becomes "saturated" in the old companies)
After exploring the database I can now update my possible hypotheses list:
- Limitations of app discovered: Look at device and email usage over time
- Saturation: Look at number of companies with it's first user joining the app over time
The following are some new hypotheses I feel are worth exploring
- User Retention Problem: Look at users engagement behavior when they first join and track them for many weeks after
- Marketing Problem: The amount of new users joining the app is declining overtime. Saturation is somewhat related to this hypothesis
- Signup Flow Issue: Maybe users are signing up but there is an issue with account activation
- Login Issue: Maybe users had difficulty logging in for a period in time
Below are some reasons why I chose to not include some of my initial hypotheses.
- End of work cycle: First there is no direct data to explore this idea. Secondly we know that our users actually come from a lot of different companies and the likelihood of all these companies being similar is quite low.
- Coordinated Vacation: This one could be explored indirectly using engagements and location data but we know that our users do come from diverse locations. Additionally I checked holidays around the world between the end of July to the end of August (this is the time period that the engagements experienced the drop) and I didn't find a holiday comparable to a high impact holiday such as Christmas.
- Competing platform: No data available to explore this idea. I want questions that could be answered by the data made available to me.
- Company testing another app: This idea is too similar to competing platforms and there also isn't really data to explore this. If I have some free time I could ask the marketing/business teams about competitors but for now this idea and the previous idea won't be a priority.
- Novelty wearing off: I realized that this idea is a possible explanation for a greater problem and I would rather explore this greater problem first. Instead of including this hypothesis I instead made a new hypothesis called "User Retention Problem". If I find that there is in fact a user retention problem I may return to explore this idea as well. As far as data goes I feel that the data provided may be able to give some insight to this problem but I can't quite pinpoint what data. It's a hunch which is another reason why I would prefer to explore it later if I felt it was worth investing the time.
Moving forward it's time to prioritize the order in which I will explore my hypotheses.
- Marketing Problem(If I feel that this is a problem I will then explore Saturation directly after, if not I'll explore it after everything else is explored)
- Login Issue
- Signup Flow Issue
- User Retention Problem
- Limitations of app discovered
Now that I have made a list of hypotheses I feel are possible explanations for a drop in user engagement it's time to begin analysis. This will be the subject of part two of my dive into the Yammer business problem.

Top comments (0)