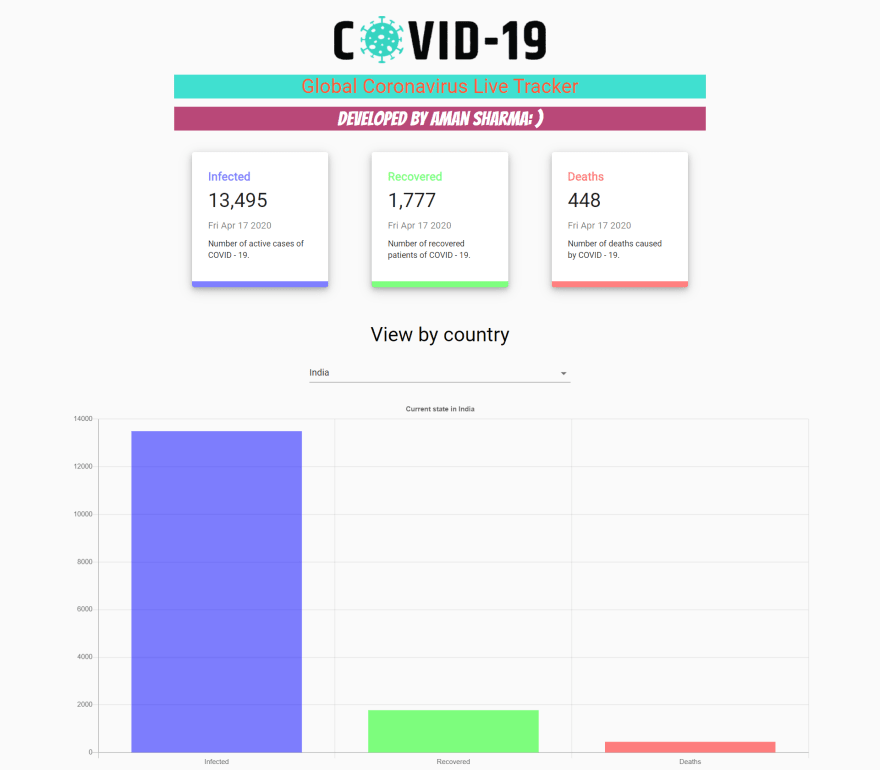
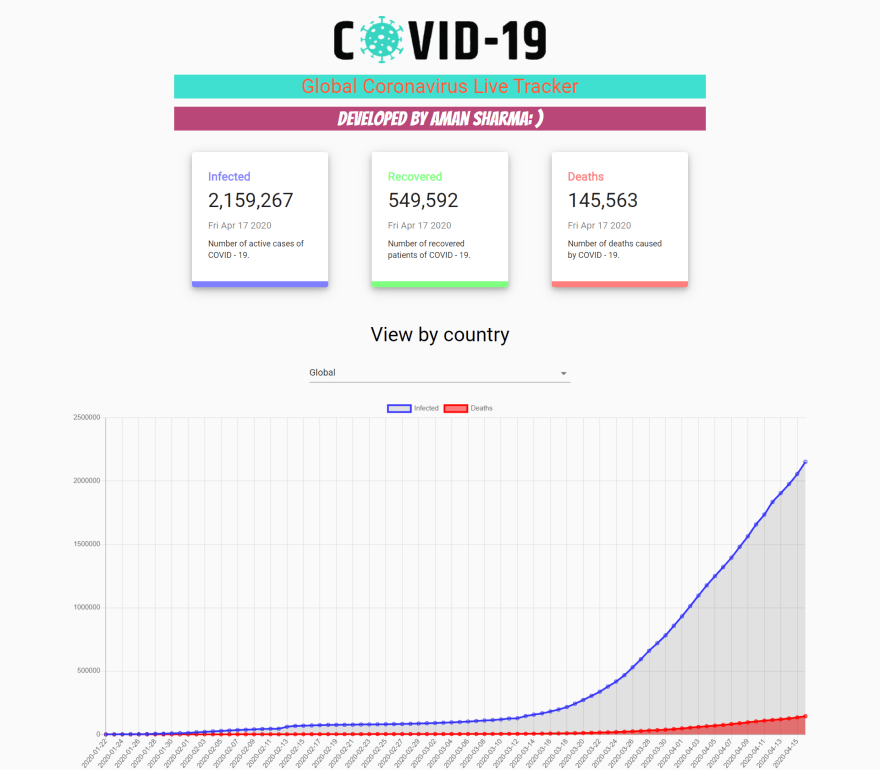
Tracking the Coronavirus pandemic across the globe. This is a real-time web application for live tracking cases of covid19 throughout the world(Globally). Tracks the cases of infected people, recovery people, and death people globally as well as country wise.
This is the first real-time project I have worked on. While doing this project I have learned how to use Material UI, Charts.js, React Hooks, API data fetching, all of it in React JS!
Demo Link
Try it online (it is live) Click here
Link to Code
 Aman22sharma
/
covid_19_tracker_app
COVID 19 Live Tracker Real Time Application [ React application ]
COVID-19 Live Tracker Web Application
This project was bootstrapped with Create React App.
Website Link- https://covid-19-livetracker.netlify.com.
Global Data set and Graphical representation
Country wise data set and graphical representaion

Available Scripts
In the project directory, you can run:
npm start
Runs the app in the development mode.
Open http://localhost:3000 to view it in the browser.
The page will reload if you make edits.
You will also see any lint errors in the console.
npm test
Launches the test runner in the interactive watch mode.
See the section about running tests for more information.
npm run build
Builds the app for production to the build folder.
It correctly bundles React in production mode and optimizes the build for the best performance.
The build is minified and the filenames include the hashes.
Your app is ready to be deployed!
See the section about deployment for more information.
npm run eject
…
How I built it (what's the stack? did I run into issues or discover something new along the way?)
This project is one of the challenging projects for me. This is a real-time web application. This is developed using React js, API Calls, Material UI, Node js, Git, and Github. React js is used for the front end part, Api calls is used for fetching the data, Material UI is used for react components, Node js is used for Server-side handling and Git and Github is used for Version control.
The aim is to develop this application is for showing all the current daily updated data of Infected people, Recovery people, and Deaths people all over the world. You can see also the current situation of any country over the world with the help of the graph chart.
This is going to fetch the live data from the API using Async/Await syntax. All the data of current covid19 cases fetching through https://covid19.mathdro.id/api. There are three card components the first one shows the current cases of infected people the second shows the current cases of recovery people and the third one shows the current cases of deaths people. you can see all the data globally as well as country-wise.
An integrated graph chart shows the current growth of covid19 cases with the help of chart js.
Thank you.


Top comments (0)