Photo by Stephen Dawson on Unsplash
The Problem
We desired to track some performance counters from dotnet core services running either on Docker containers or in k8s pods.
In Process: prometheus-net
We found one project allowing to publish from the process to Prometheus. This article is a good walkthrough to know how to publish quickly metrics.
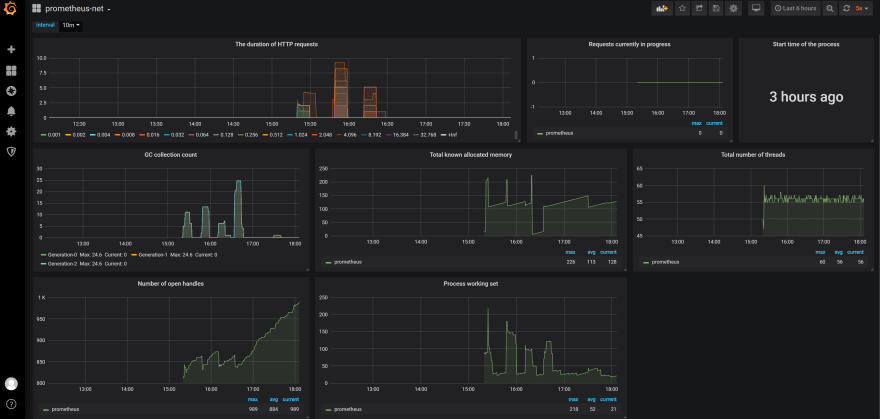
There is even a Grafana Dashboard to display metrics.

Out Process: dotnet-trace
Of course, publishing metrics costs.
So if you want to get metrics without modifying it, you can use dotnet trace. A great video in AspNet Core series explains how to use it, and visualize it in a flamegraph through speedscope.
To go beyond, you can read this article on how to retrieve CPU traces from a sidecar container.
Edit: you can read this article on dotnet monitor.
Hope this helps !


Top comments (0)