At Appaloosa we often process CSV. When we process thousands of CSV lines of users that need to be added to (or removed from) a group, we are seeing a huge increase in memory. Sometimes the Heroku dynos cannot manage it.
We will explain how we jump from this when processing 4_000 users (look at blue line but also time):

To that:

memory profiler
We used stackprof, memory_profiler. We look at tool like speedscope for stackprof results and always it point at heavy use of ActiveRecord. Also we noticed in “Allocated String Report” of memory_profiler a string allocated multiples times.
With 4000 users:
Allocated String Report
-----------------------------------
   1619100  "decorated?"
   1619100  .rvm/gems/ruby-2.5.3@app/gems/activerecord-5.2.1/lib/active_record/attribute_methods.rb:279
"decorated?" where does it come from?
It’s instantiated here: .rvm/gems/ruby-2.5.3@app/gems/activerecord-5.2.1/lib/active_record/attribute_methods.rb:281
If we add a puts caller when "decorated?" is instantiated we have this:
First we didn’t understand how we can jump from Draper to active_record/associations/collection_association.rb like:
The code on Draper part is:
Then the code in active_record/associations/collection_association.rb:281 looks like:
We jump from index = @target.index(record) to Draper::Decoratable::Equality.== 🤔.
But how?
Christophe Maximin (thanks a lot, Christophe) came with this answer:
(Wild guess by just reading the AR code) Because if the same user (same primary key) is already in users, it just replaces that old object with the new object you’re passing with <<, which is why it needs to know the index of the old one. And to know if records are the same, it needs to call ==.
If you want a full example of how it is called, you can use [TracePoint](https://ruby-doc.org/core-2.5.3/TracePoint.html). Without and with having == in Integer:
Tracepoint “Establishes proc as the handler for tracing” calls
:call:for call to Ruby method:c_call:for a call to a C-language routine
What happens on a real app?
To be sure we were not testing a side effect of our app, we created a new rails app, with 2 models, Draper installed. Then we monkey patched add_to_target for ActiveRecord.
We put the code to reproduce the concatenation in a rake task.
If we add two records rails concat_records:comments[2] on the second record we have this interesting result:
We can see that we are calling index, then Draper::Decoratable::Equality (that override ==), then ActiveRecord:Core, etc...
The issue is when the array of record we concat contains lot’s of ActiveRecord objects. Every time we add one element, we redo all of those calls. Also Draper in is Equality method add more calls, and one of the call adds :decorated? string. All of this chain have a cost.
Let’s measure it.
Measuring allocation with Draper, without Draper, without concatenation
With Draper (branch)
Draper gem installed. No decorators defined but == is overridden by Draper as we can see.
If we run a measure with memory_profiler: rails concat_records:comments[2000]. We get:
Total allocated: 327.93 MB (4862043 objects)

Total retained:  17.67 MB (172370 objects)
And we can see also:
Allocated String Report

-----------------------------------

1999000  "decorated?"

1999000  .rvm/gems/ruby-2.5.3/gems/activerecord-5.2.1/lib/active_record/attribute_methods.rb:282
Without Draper (branch)
First we don’t have any more the very present allocated string "decorated?". First allocated string is ”” with 40185 occurrences. That’s a gain of 1 958 815 strings.
Allocated String Report

-----------------------------------

40185  ""

24000  .rvm/gems/ruby-2.5.3/gems/activesupport-5.2.1/lib/active_support/tagged_logging.rb:23
If we run a measure with memory_profiler rails concat_records:comments[2000]. We get:
Total allocated: 247.97 MB (2863011 objects)

Total retained:  17.67 MB (172370 objects)
It’s little bit better.
Without concat but with Draper (branch)
Same as before without Draper we don’t have any more very present allocated string "decorated?":
Allocated String Report

-----------------------------------

40185  ""

24000  .rvm/gems/ruby-2.5.3/gems/activesupport-5.2.1/lib/active_support/tagged_logging.rb:23
And…
Total allocated: 218.73 MB (2377978 objects)

Total retained:  31.95 kB (284 objects)
This is a huge gain but we don’t validate that we don’t create a duplicated entry into the join table. But this is something easy to handle.
How this can happening?
- If their is a
distincton the association scope like this:
Then when ActiveRecord needs to concatenate. It will call
@target.index(record). If@targethave a lot's of elements this will consume more some CPU and memory.And if Draper is installed this will add extra cost because Draper override
==called fromindex. This override will allocate extra strings we don't need ("decorated?").
Looking in index plus using Draper is a logarithmic cost for iteration per second and memory. More element you have in "target" slower it gets.
So careful when using distinct in a scope. Also careful with Draper.
Here is a diagram of what is happening
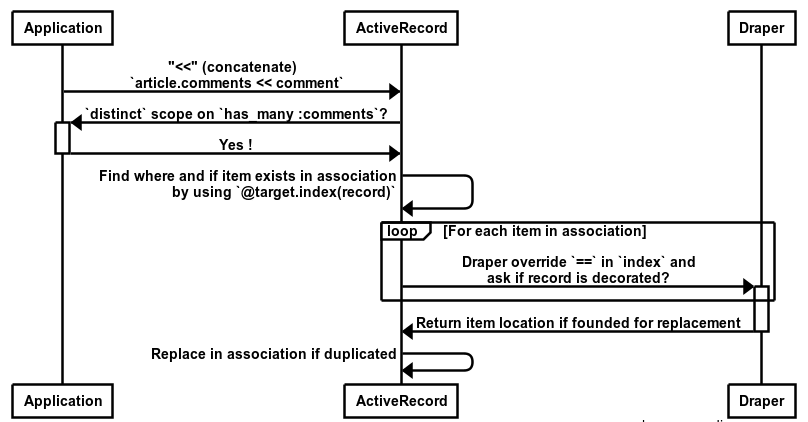 Diagram of index search and Draper override
In our code base the patch looks like:

Thanks
Thanks to Appaloosa Team, Christophe Maximin, Ryuta Kamizono (kamipo), Nate Berkopec and the Rails Speed Community Slack.
👋
You should subscribe to our blog to be notified whenever a new article is available!
This article was written by Benoit Tigeot of Appaloosa’s dev team.

Top comments (0)