
In this article, we are trying to accomplish creating a CloudTrail trail using an Infrastructure as Code service (Terraform) that pushes cloudtrail event logs to CloudWatch for analysis.
AWS CloudTrail
This is a service that helps account administrators to have visibility into actions performed by Users, Roles or AWS Services which are recorded as events (Events include actions taken in the AWS Management Console, AWS Command Line Interface, and AWS SDKs and APIs). This is to achieve operational and risk auditing, governance, and compliance of your AWS account.
Imagine an organization with over 100 employees having to access company AWS environment, there must be some form of accountability and traceability of employee activities. The CloudTrail service is useful for this scenario. CloudTrail is enabled by default on your AWS account when you create it. You can easily view recent events in the CloudTrail console by going to Event history.
We create a CloudTrail trail to archive, analyze, and respond to changes in our AWS resources. A trail is a configuration that enables delivery of events to a specified Amazon S3 bucket . You can also deliver and analyze events in a trail with Amazon CloudWatch Logs and Amazon CloudWatch Events which we plan to do here.
Terraform Code
HashiCorp Terraform is an infrastructure as code tool that lets you define both cloud and on-prem resources in human-readable configuration files that you can version, reuse, and share.
Terraform creates and manages resources on cloud platforms and other services through their application programming interfaces (APIs). Providers enable Terraform to work with virtually any platform or service with an accessible API.

We develop our code using any IDE of our choice but I prefer to make use of VsCode. First of, Install Terraform locally - see Terraform Installation Guide
In our VsCode we create our provider.tf file. This enables terraform to work with the Cloud Platform and it's services.
terraform {
  required_providers{
      aws = {
          source = "hashicorp/aws"
      }

  }
}
provider "aws" {
     region = "Your preferred Region"
 }
We develop our main.tf file where we create our main resources.
data "aws_caller_identity" "current" {}

resource "aws_iam_role_policy" "cloudtrail_test_rolepolicy" {
  name = "cloudtrail-policy"
  role = aws_iam_role.cloudtrail_test_role.id

  policy = jsonencode({
  "Version": "2012-10-17",
  "Statement": [
    {
      "Sid": "AWSCloudTrailCreateLogStream",
      "Effect": "Allow",
      "Action": ["logs:CreateLogStream"],
      "Resource": ["arn:aws:logs:region:account-id:log-group:${aws_cloudwatch_log_group.awss3bucketloggroups.id}:*"
      ]

    },
    {
      "Sid": "AWSCloudTrailPutLogEvent",
      "Effect": "Allow",
      "Action": ["logs:PutlogEvents"],
      "Resource": ["arn:aws:logs:region:account-id:log-group:${aws_cloudwatch_log_group.awss3bucketloggroups.id}:*"
      ]
    }
  ]

})

}

resource "aws_iam_role"  "cloudtrail_test_role" {
  name = "cloudtrail-to-cloudwatch"

  assume_role_policy = jsonencode({
  "Version": "2012-10-17",
  "Statement": [
    {
      "Effect": "Allow",
      "Principal": {
        "Service": "cloudtrail.amazonaws.com"
      },
      "Action": "sts:AssumeRole"
    }
  ]
})

}

resource "aws_cloudtrail" "my_trail" {
  name                          = "my_trail"
  s3_bucket_name                = aws_s3_bucket.trail.id
  s3_key_prefix                 = "cloudtrailkey"
  include_global_service_events = true
  cloud_watch_logs_group_arn = "${aws_cloudwatch_log_group.awss3bucketloggroups.arn}:*"
  cloud_watch_logs_role_arn = "${aws_iam_role.cloudtrail_test_role.arn}"
  depends_on = [aws_s3_bucket_policy.CloudtrailS3, aws_s3_bucket.trail]
}

resource "aws_s3_bucket" "trail" {
  bucket        = "internal-test-task-trail"
  force_destroy = true
}

resource "aws_cloudwatch_log_group" "awss3bucketloggroups" {
  name = "log-stream"
}

resource "aws_s3_bucket_policy" "CloudtrailS3" {
  bucket = aws_s3_bucket.trail.id
  depends_on = [aws_s3_bucket.trail]
  policy = jsonencode({
  "Version": "2012-10-17",
  "Statement": [
    {
      "Sid": "AWSCloudTrailAclCheck",
      "Effect": "Allow",
      "Principal": {
        "Service": "cloudtrail.amazonaws.com"
      },
      "Action": "s3:GetBucketAcl",
      "Resource": "${aws_s3_bucket.trail.arn}"
    },
    {
      "Sid": "AWSCloudTrailWrite",
      "Effect": "Allow",
      "Principal": {
        "Service": "cloudtrail.amazonaws.com"
      },
      "Action": "s3:PutObject",
      "Resource": "${aws_s3_bucket.trail.arn}/cloudtrailkey/AWSLogs/${data.aws_caller_identity.current.account_id}/*",
      "Condition": {
        "StringEquals": {
          "s3:x-amz-acl": "bucket-owner-full-control"
        }
      }
    }
  ]
})

}
After creating both files in the same directory, open a terminal and be in the directory of the terraform files and run the following commands
1. terraform fmt
2. terraform init
3. terraform validate
4. terraform plan
5. terraform apply
1. fmt
This command reformats your configuration in the standard style, so it'll make sure that the spacing and everything else is formatted correctly. If it comes back blank, that means the configuration files within your working directory are already correctly formatted. If it does format a file, it will let you know what file it touched.
2. init
After you use the format command, you'll want to initialize your working directory to prepare it for what you need. The init command looks at your configuration files and determines which providers and modules it needs to pull down from the registry to allow your configuration to work properly.
3. validate
Once you've initialized the directory, it's good to run thevalidate command before you run plan or apply. Validation will catch syntax errors, version errors, and other issues. One thing to note here is that you can't run validate before you run the init command. You have to initialize the working directory before you can run the validation.
4. plan
Next, it's always a good idea to do a dry run of your plan to see what it's actually going to do. You can even use one of the subcommands with terraform plan to output your plan to apply it later.
5. apply
And then of course you have your apply command, which is one of the commands you're going to use the most. This is the command that deploys or applies your configuration to a provider.
Verify in your console if you can see the various resources deployed.
CloudWatch Logs Insight & Dashboard
CloudWatch Logs Insights enables you to interactively search and analyze your log data in Amazon CloudWatch Logs. You can perform queries to help you more efficiently and effectively respond to operational issues. If an issue occurs, you can use CloudWatch Logs Insights to identify potential causes and validate deployed fixes.
In this article we try to derive insight into our CloudTrail Trail logs and publish them to a CloudWatch Dashboard.
Few Sample CloudTrail Logs Queries. More can be found here. You can test them by clicking on the Logs Insights on the left menu pane in your cloudwatch console. On the main page, select the name of the log group created and run the default query you see.

On the Logs Insights page, on your right hand side menu, you will find Queries, click on it. You will get sample queries based on the Service you want.

Here are two queries I used in creating the sample dashboard.
- Number of log entries by Service, event and region
stats count(*) by eventSource, eventName, awsRegion
- Latest 20 logs streamed
fields @timestamp, @message, @logStream, @log
| sort @timestamp desc
| limit 20
Creating the dashboard
In your CloudWatch console, click on Dashboard
On the dashboard page, click on "Create dashboard"
Name the dashboard and click on "Create dashboard"
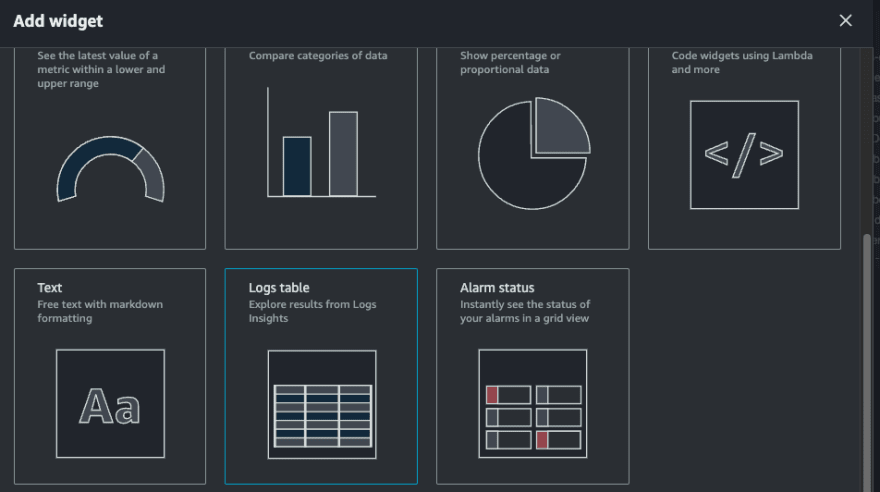
On the Add widget pop-up page, choose any widget of your choice. In this tutorial we will pick Pie.

We will select logs on the next pop-up (data source to create the widget)
Select the log group you are working on.
Paste or write in your query and run query
On the top click on create widget
This publishes the widget on the dashboard. To add a new widget, Click on the + icon beside save on the top right hand corner.
![]()
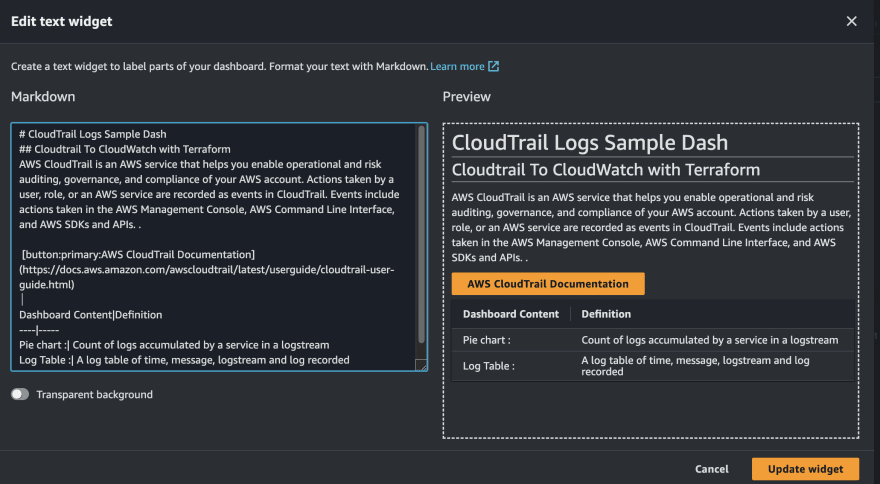
- Add a new widget, this time we will go with Text
- Edit the details to what you prefer. You do the editing on the Markdown side and preview on the Preview side. When done, click on create widget.
Click on Save at the top right hand side to save the Dashboard.

You now have your Dashboard, you can create more widgets as you wish.
Happy Learning!!!!
References
CloudWatchLogs
QuerySyntax
CloudTrail
By: David Awanta, Cloud Engineer - ScaleCapacity Inc., AWS Community Builder

Top comments (0)