In the previous post, we saw that there are different types of load tests and what their objectives and characteristics are. In this text, we will see how to implement them using a tool called k6.
k6 is an open-source tool maintained by Grafana Labs, the organization behind large projects such as Grafana, Prometheus, Mimir, and Loki. The tool is written in Go and has a built-in JavaScript script processing engine, the language used to define load tests.
Without further ado, let's get our hands dirty.
The first step is to install the tool.
On macOS, the command was enough:
brew install k6
The official documentation shows how to install it on other operating systems.
Before running the first test, let's define which application we will use as a target. k6 provides a testing area, https://test.k6.io/, with some APIs we can use for demonstration. But I made a small API in Go for this case, just for teaching purposes. The application code is:
package main

import (
    "net/http"

    "github.com/go-chi/chi/v5"
    "github.com/go-chi/chi/v5/middleware"
)

func main() {
    r := chi.NewRouter()
    r.Use(middleware.Logger)
    r.Get("/", func(w http.ResponseWriter, r *http.Request) {
        w.Write([]byte("welcome"))
    })
    http.ListenAndServe(":3000", r)
}
The code is quite simple, as it is not the main focus of this text but instead load testing with k6.
According to the types described in the previous post, let's start creating our tests.
Smoke testing
I created the skeleton of the first test using the command:
k6 new tests/smoke-test.js
I removed some comments generated by the command above, and the code for our first test looked like this:
import http from 'k6/http';
import { sleep } from 'k6';

export const options = {
  vus: 1,
  duration: '5s',
}

export default function () {
  http.get('http://192.168.68.108:3000');
  sleep(1);
}
The options variable contains the test configuration. In this case, we will simulate one user, or vu (Virtual User), accessing for 5 seconds. The function default defines the actions that this user will perform. This function will run for each user for the duration of the test. In this case, we will make a get request to the machine where our Go API is running. I will use one machine to run the tests and another to host the application.
The command sleep simulates a user's behavior, as in real life, the person needs some time between operations, for example, to move the mouse between links, etc. We always try to emulate a user's behavior and not a bot.
Now, we can run the test with the command:
k6 run tests/smoke-test.js
The result was:
❯ k6 run tests/smoke-test.js

          /\      |‾‾| /‾‾/   /‾‾/
     /\  /  \     |  |/  /   /  /
    /  \/    \    |     (   /   ‾‾\
   /          \   |  |\  \ |  (‾)  |
  / __________ \  |__| \__\ \_____/ .io

  execution: local
     script: tests/smoke-test.js
     output: -

  scenarios: (100.00%) 1 scenario, 1 max VUs, 35s max duration (incl. graceful stop):
           * default: 1 looping VUs for 5s (gracefulStop: 30s)


     data_received..................: 615 B 117 B/s
     data_sent......................: 425 B 81 B/s
     http_req_blocked...............: avg=8.59ms  min=10µs    med=12µs    max=42.9ms  p(90)=25.74ms p(95)=34.32ms
     http_req_connecting............: avg=8.57ms  min=0s      med=0s      max=42.87ms p(90)=25.72ms p(95)=34.29ms
     http_req_duration..............: avg=37.9ms  min=12.31ms med=45.33ms max=48.94ms p(90)=48.7ms  p(95)=48.82ms
       { expected_response:true }...: avg=37.9ms  min=12.31ms med=45.33ms max=48.94ms p(90)=48.7ms  p(95)=48.82ms
     http_req_failed................: 0.00% ✓ 0        ✗ 5
     http_req_receiving.............: avg=133.2µs min=56µs    med=168µs   max=184µs   p(90)=182.8µs p(95)=183.4µs
     http_req_sending...............: avg=52µs    min=42µs    med=53µs    max=62µs    p(90)=59.6µs  p(95)=60.8µs
     http_req_tls_handshaking.......: avg=0s      min=0s      med=0s      max=0s      p(90)=0s      p(95)=0s
     http_req_waiting...............: avg=37.72ms min=12.21ms med=45.1ms  max=48.7ms  p(90)=48.46ms p(95)=48.58ms
     http_reqs......................: 5     0.953716/s
     iteration_duration.............: avg=1.04s   min=1.03s   med=1.04s   max=1.05s   p(90)=1.05s   p(95)=1.05s
     iterations.....................: 5     0.953716/s
     vus............................: 1     min=1      max=1
     vus_max........................: 1     min=1      max=1


running (05.2s), 0/1 VUs, 5 complete and 0 interrupted iterations
default ✓ [======================================] 1 VUs  5s
Let's analyze the most relevant information in this report.
-
http_request_duration: shows the total time between sending the request and its response. -
http_req_failed: shows the percentage of requests that failed -
http_reqs: the number of requests that were fulfilled
The report shows more information, but we will focus on these main ones now.
The report shows some metrics in different forms: average (avg), minimum (min), median (med), maximum (max), 90th percentile (p90) and 95th percentile (p95). The first values are self-explanatory, while p90 means that the API answered 90% of the requests in 48.7ms or more in the case of http_request_duration. And p95 tells us that the API answered 95% of requests in 48.82ms or more. Analyzing p90 and p95 values is a good practice in load testing, as they tell a more detailed story than the average or median. We will use these values extensively in our analyses.
Load testing
Let's use k6 to create a test that implements the following scenario:
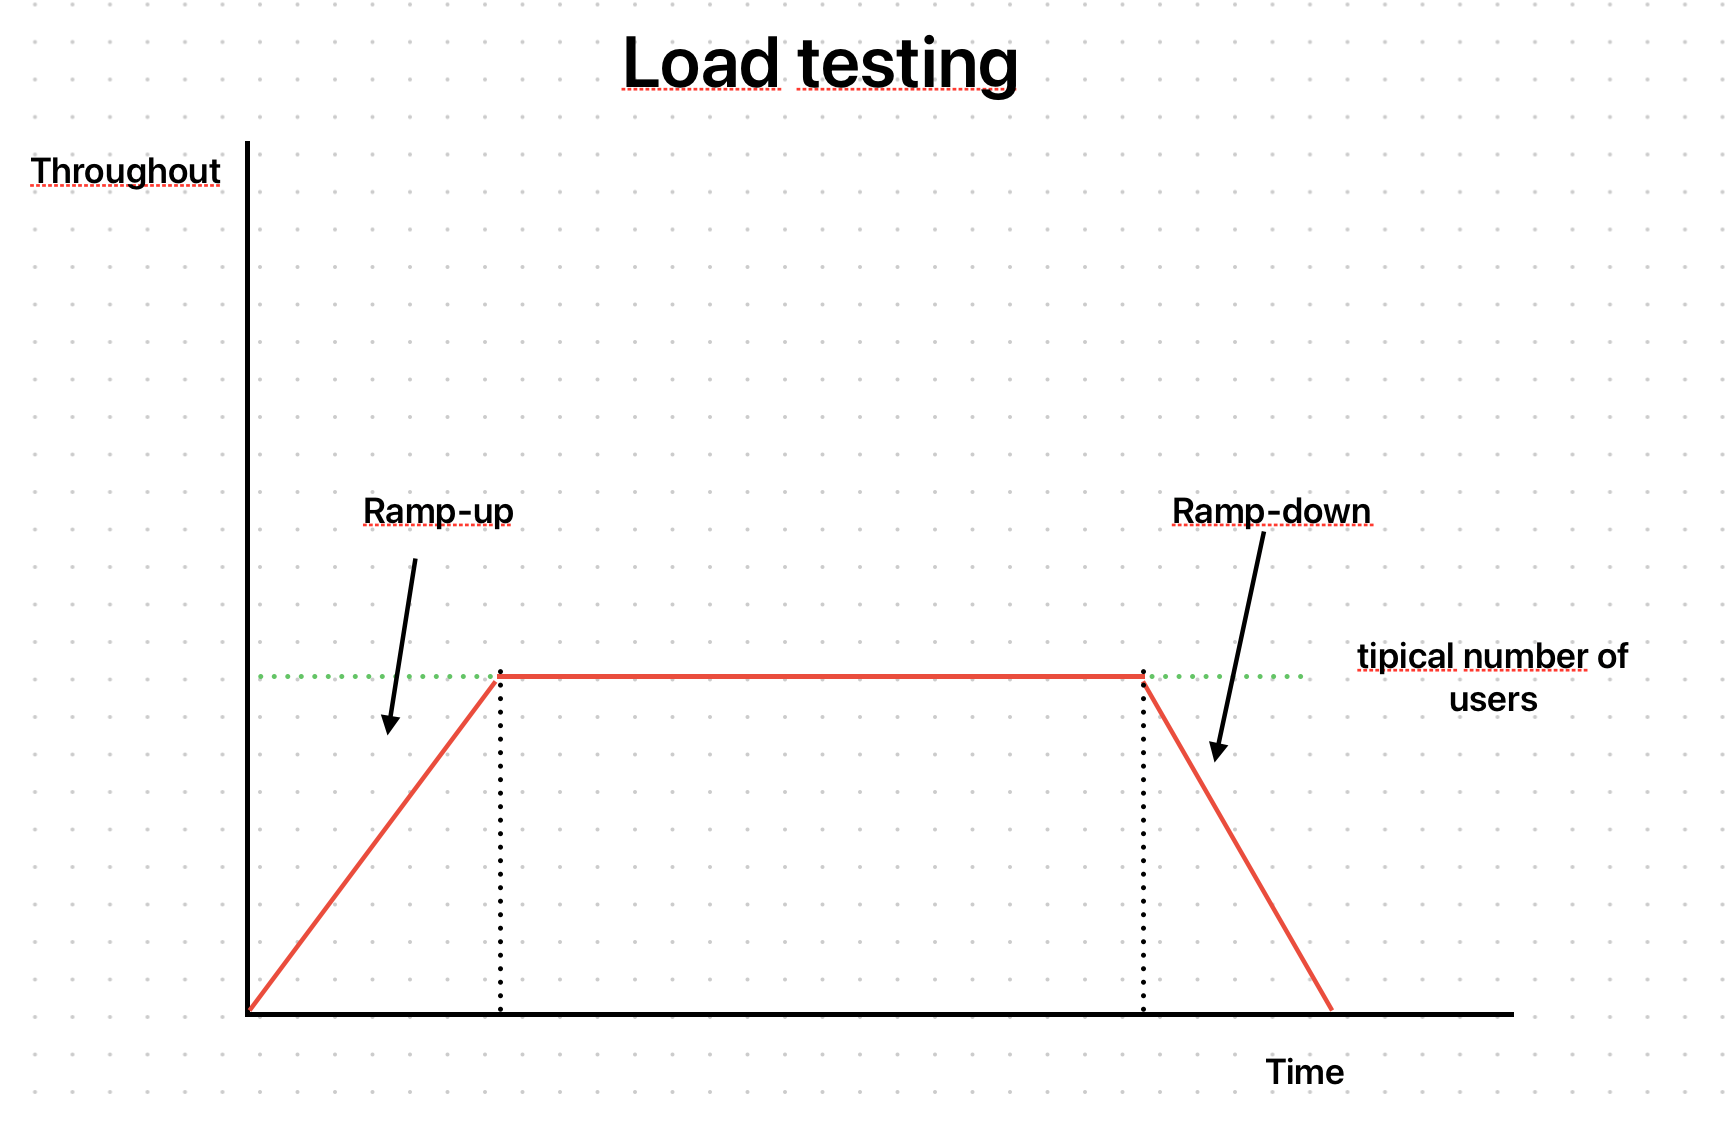
To do this, we will use a k6 feature called stages. The code for our new test looked like this:
import http from 'k6/http';
import { sleep } from 'k6';

export const options = {
    stages: [
        {
            duration: '10s',
            target: 100
        },
        {
            duration: '30s',
            target: 100
        },
        {
            duration: '10s',
            target: 0
        }
    ]
}

export default function () {
    http.get('http://192.168.68.108:3000');
    sleep(1);
}
With this test, we could simulate the scenario of a ramp-up with the first stage. The test will run for 10 seconds, gradually increasing the number of users until it reaches 100. Then, it will run accesses with these 100 users for 30 seconds, and, finally, it will take another 10 seconds to decrease the number until it reaches zero.
The result of the execution was:
❯ k6 run tests/load-test.js

          /\      |‾‾| /‾‾/   /‾‾/
     /\  /  \     |  |/  /   /  /
    /  \/    \    |     (   /   ‾‾\
   /          \   |  |\  \ |  (‾)  |
  / __________ \  |__| \__\ \_____/ .io

  execution: local
     script: tests/load-test.js
     output: -

  scenarios: (100.00%) 1 scenario, 100 max VUs, 1m20s max duration (incl. graceful stop):
           * default: Up to 100 looping VUs for 50s over 3 stages (gracefulRampDown: 30s, gracefulStop: 30s)


     data_received..................: 458 kB 9.0 kB/s
     data_sent......................: 316 kB 6.2 kB/s
     http_req_blocked...............: avg=667.11µs min=1µs    med=4µs    max=105.83ms p(90)=10µs     p(95)=13µs
     http_req_connecting............: avg=658.34µs min=0s     med=0s     max=105.68ms p(90)=0s       p(95)=0s
     http_req_duration..............: avg=91.44ms  min=5.94ms med=92.4ms max=409.05ms p(90)=207.7ms  p(95)=230.13ms
       { expected_response:true }...: avg=91.44ms  min=5.94ms med=92.4ms max=409.05ms p(90)=207.7ms  p(95)=230.13ms
     http_req_failed................: 0.00%  ✓ 0         ✗ 3720
     http_req_receiving.............: avg=44.72µs  min=13µs   med=36µs   max=682µs    p(90)=71µs     p(95)=103µs
     http_req_sending...............: avg=50.59µs  min=5µs    med=14µs   max=2.23ms   p(90)=78.1µs   p(95)=227.04µs
     http_req_tls_handshaking.......: avg=0s       min=0s     med=0s     max=0s       p(90)=0s       p(95)=0s
     http_req_waiting...............: avg=91.34ms  min=5.87ms med=92.2ms max=409ms    p(90)=207.51ms p(95)=230.08ms
     http_reqs......................: 3720   73.335688/s
     iteration_duration.............: avg=1.09s    min=1s     med=1.09s  max=1.4s     p(90)=1.2s     p(95)=1.23s
     iterations.....................: 3720   73.335688/s
     vus............................: 7      min=7       max=100
     vus_max........................: 100    min=100     max=100


running (0m50.7s), 000/100 VUs, 3720 complete and 0 interrupted iterations
default ✓ [======================================] 000/100 VUs  50s
Analyzing the results, we can observe the following:
-
http_request_duration:p(90)=207.7msandp(95)=230.13ms -
http_req_failed:0% -
http_reqs:3720or,73.335688/s
According to the definition of this type of test, this is the expected behavior for our API. These are the minimum values we hope our application will respond to. In the following topics, we will test the limits of the application.
Stress testing
Let's now put more pressure on our application, simulating the scenario:
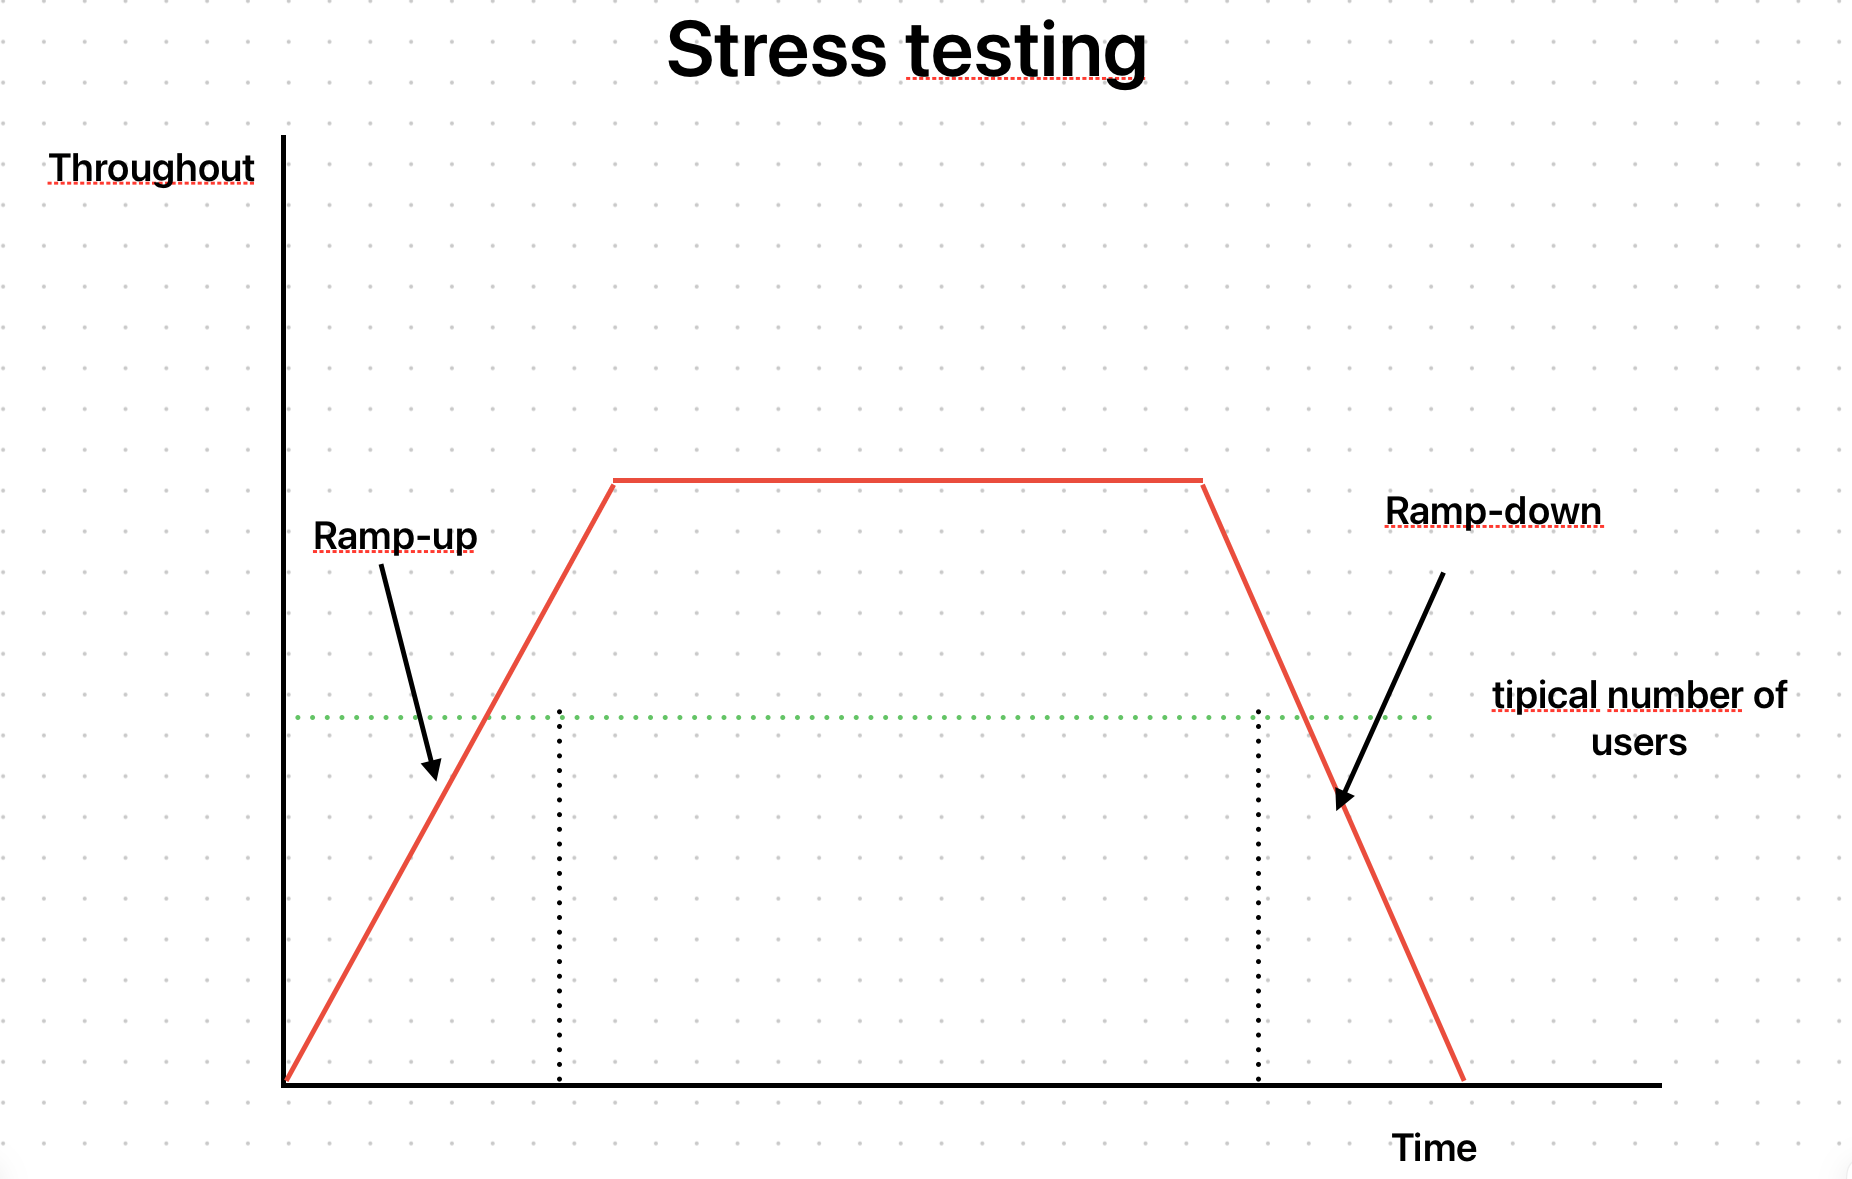
Let's double the load to analyze the API behavior:
import http from 'k6/http';
import { sleep } from 'k6';

export const options = {
    stages: [
        {
            duration: '10s',
            target: 200
        },
        {
            duration: '30s',
            target: 200
        },
        {
            duration: '10s',
            target: 0
        }
    ]
}

export default function () {
    http.get('http://192.168.68.108:3000');
    sleep(1);
}
The result of the execution was:
❯ k6 run tests/stress-test.js

          /\      |‾‾| /‾‾/   /‾‾/
     /\  /  \     |  |/  /   /  /
    /  \/    \    |     (   /   ‾‾\
   /          \   |  |\  \ |  (‾)  |
  / __________ \  |__| \__\ \_____/ .io

  execution: local
     script: tests/stress-test.js
     output: -

  scenarios: (100.00%) 1 scenario, 200 max VUs, 1m20s max duration (incl. graceful stop):
           * default: Up to 200 looping VUs for 50s over 3 stages (gracefulRampDown: 30s, gracefulStop: 30s)


     data_received..................: 914 kB 18 kB/s
     data_sent......................: 632 kB 13 kB/s
     http_req_blocked...............: avg=709.98µs min=1µs    med=4µs     max=590.31ms p(90)=8µs      p(95)=11µs
     http_req_connecting............: avg=701.63µs min=0s     med=0s      max=590.23ms p(90)=0s       p(95)=0s
     http_req_duration..............: avg=91.79ms  min=4.69ms med=54.47ms max=1.02s    p(90)=215.15ms p(95)=240.84ms
       { expected_response:true }...: avg=91.79ms  min=4.69ms med=54.47ms max=1.02s    p(90)=215.15ms p(95)=240.84ms
     http_req_failed................: 0.00%  ✓ 0          ✗ 7431
     http_req_receiving.............: avg=41.07µs  min=10µs   med=36µs    max=577µs    p(90)=63µs     p(95)=82µs
     http_req_sending...............: avg=45.08µs  min=4µs    med=14µs    max=2.6ms    p(90)=59µs     p(95)=166.49µs
     http_req_tls_handshaking.......: avg=0s       min=0s     med=0s      max=0s       p(90)=0s       p(95)=0s
     http_req_waiting...............: avg=91.71ms  min=4.61ms med=54.42ms max=1.02s    p(90)=215.09ms p(95)=240.79ms
     http_reqs......................: 7431   147.939696/s
     iteration_duration.............: avg=1.09s    min=1s     med=1.05s   max=2.03s    p(90)=1.21s    p(95)=1.24s
     iterations.....................: 7431   147.939696/s
     vus............................: 18     min=18       max=200
     vus_max........................: 200    min=200      max=200


running (0m50.2s), 000/200 VUs, 7431 complete and 0 interrupted iterations
default ✓ [======================================] 000/200 VUs  50s
Analyzing the results, we can observe the following:
-
http_request_duration:p(90)=215.15msandp(95)=240.84ms -
http_req_failed:0% -
http_reqs:7431or147.939696/s
We can now quickly run simulations, increasing the load to triple the number of accesses or another multiple that makes sense.
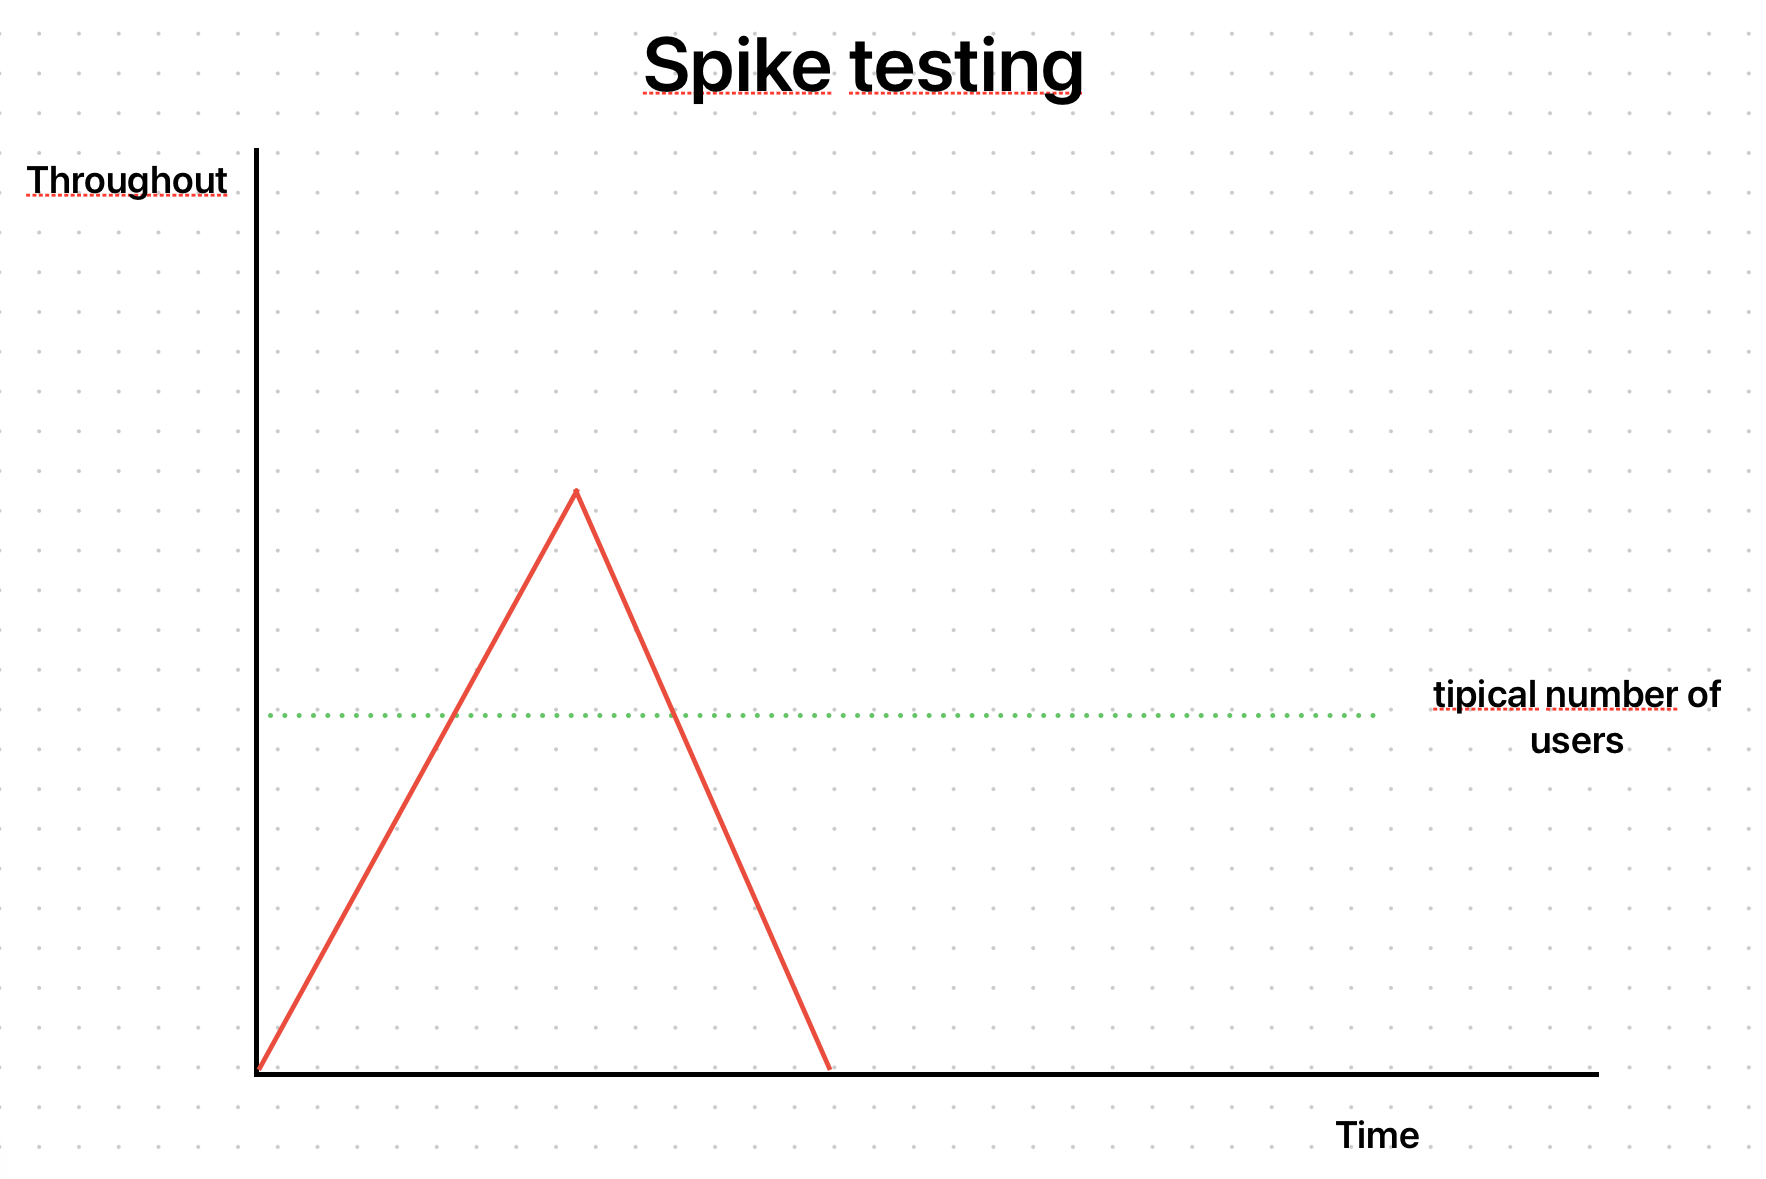
Spike testing
In this scenario, we will emulate an unexpected spike in access:
The test was as follows:
import http from 'k6/http';
import { sleep } from 'k6';

export const options = {
    stages: [
        {
            duration: '1m',
            target: 10000
        },
        {
            duration: '30s',
            target: 0
        }
    ]
}

export default function () {
    http.get('http://192.168.68.108:3000');
    sleep(1);
}
It's the result:
❯ k6 run tests/spike-test.js

          /\      |‾‾| /‾‾/   /‾‾/
     /\  /  \     |  |/  /   /  /
    /  \/    \    |     (   /   ‾‾\
   /          \   |  |\  \ |  (‾)  |
  / __________ \  |__| \__\ \_____/ .io

  execution: local
     script: tests/spike-test.js
     output: -

  scenarios: (100.00%) 1 scenario, 10000 max VUs, 2m0s max duration (incl. graceful stop):
           * default: Up to 10000 looping VUs for 1m30s over 2 stages (gracefulRampDown: 30s, gracefulStop: 30s)

WARN[0050] Request Failed     error="Get \"http://192.168.68.108:3000\": read tcp 192.168.68.106:64758->192.168.68.108:3000: read: connection reset by peer"
WARN[0050] Request Failed     error="Get \"http://192.168.68.108:3000\": read tcp 192.168.68.106:64758->192.168.68.108:3000: read: connection reset by peer"

     data_received..................: 42 MB  393 kB/s
     data_sent......................: 29 MB  272 kB/s
     http_req_blocked...............: avg=31.54ms  min=0s     med=2µs      max=14.25s  p(90)=4µs      p(95)=7µs
     http_req_connecting............: avg=31.54ms  min=0s     med=0s       max=14.25s  p(90)=0s       p(95)=0s
     http_req_duration..............: avg=296.14ms min=0s     med=103.91ms max=47.07s  p(90)=594.6ms  p(95)=1.14s
       { expected_response:true }...: avg=295.5ms  min=5.05ms med=103.79ms max=47.07s  p(90)=592.84ms p(95)=1.13s
     http_req_failed................: 0.08%  ✓ 295         ✗ 345070
     http_req_receiving.............: avg=20.58µs  min=0s     med=15µs     max=9.21ms  p(90)=29µs     p(95)=40µs
     http_req_sending...............: avg=35.69µs  min=0s     med=6µs      max=16.99ms p(90)=39µs     p(95)=113µs
     http_req_tls_handshaking.......: avg=0s       min=0s     med=0s       max=0s      p(90)=0s       p(95)=0s
     http_req_waiting...............: avg=296.08ms min=0s     med=103.84ms max=47.07s  p(90)=594.57ms p(95)=1.14s
     http_reqs......................: 345365 3200.769108/s
     iteration_duration.............: avg=1.32s    min=1s     med=1.1s     max=48.07s  p(90)=1.64s    p(95)=2.39s
     iterations.....................: 345365 3200.769108/s
     vus............................: 1      min=1         max=10000
     vus_max........................: 10000  min=10000     max=10000


running (1m47.9s), 00000/10000 VUs, 345365 complete and 4 interrupted iterations
default ✓ [======================================] 00000/10000 VUs  1m30s
Here, the situation became more interesting. The following message occurred several times in the result, and I cut it so it only took up a little space in the post.
WARN[0050] Request Failed error="Get \"http://192.168.68.108:3000\": read tcp 192.168.68.106:64758->192.168.68.108:3000: read: connection reset by peer"
Analyzing key data:
-
http_request_duration:p(90)=594.6msandp(95)=1.14s -
http_req_failed:0.08%, with295fails. -
http_reqs:345365or3200.769108/s
The application responded to the peak of accesses with performance degradation, but some requests failed. This information shows essential insights into possible improvements to the application or infrastructure. Or even to decide whether these 0.08% failures are acceptable and we don't need to do anything.
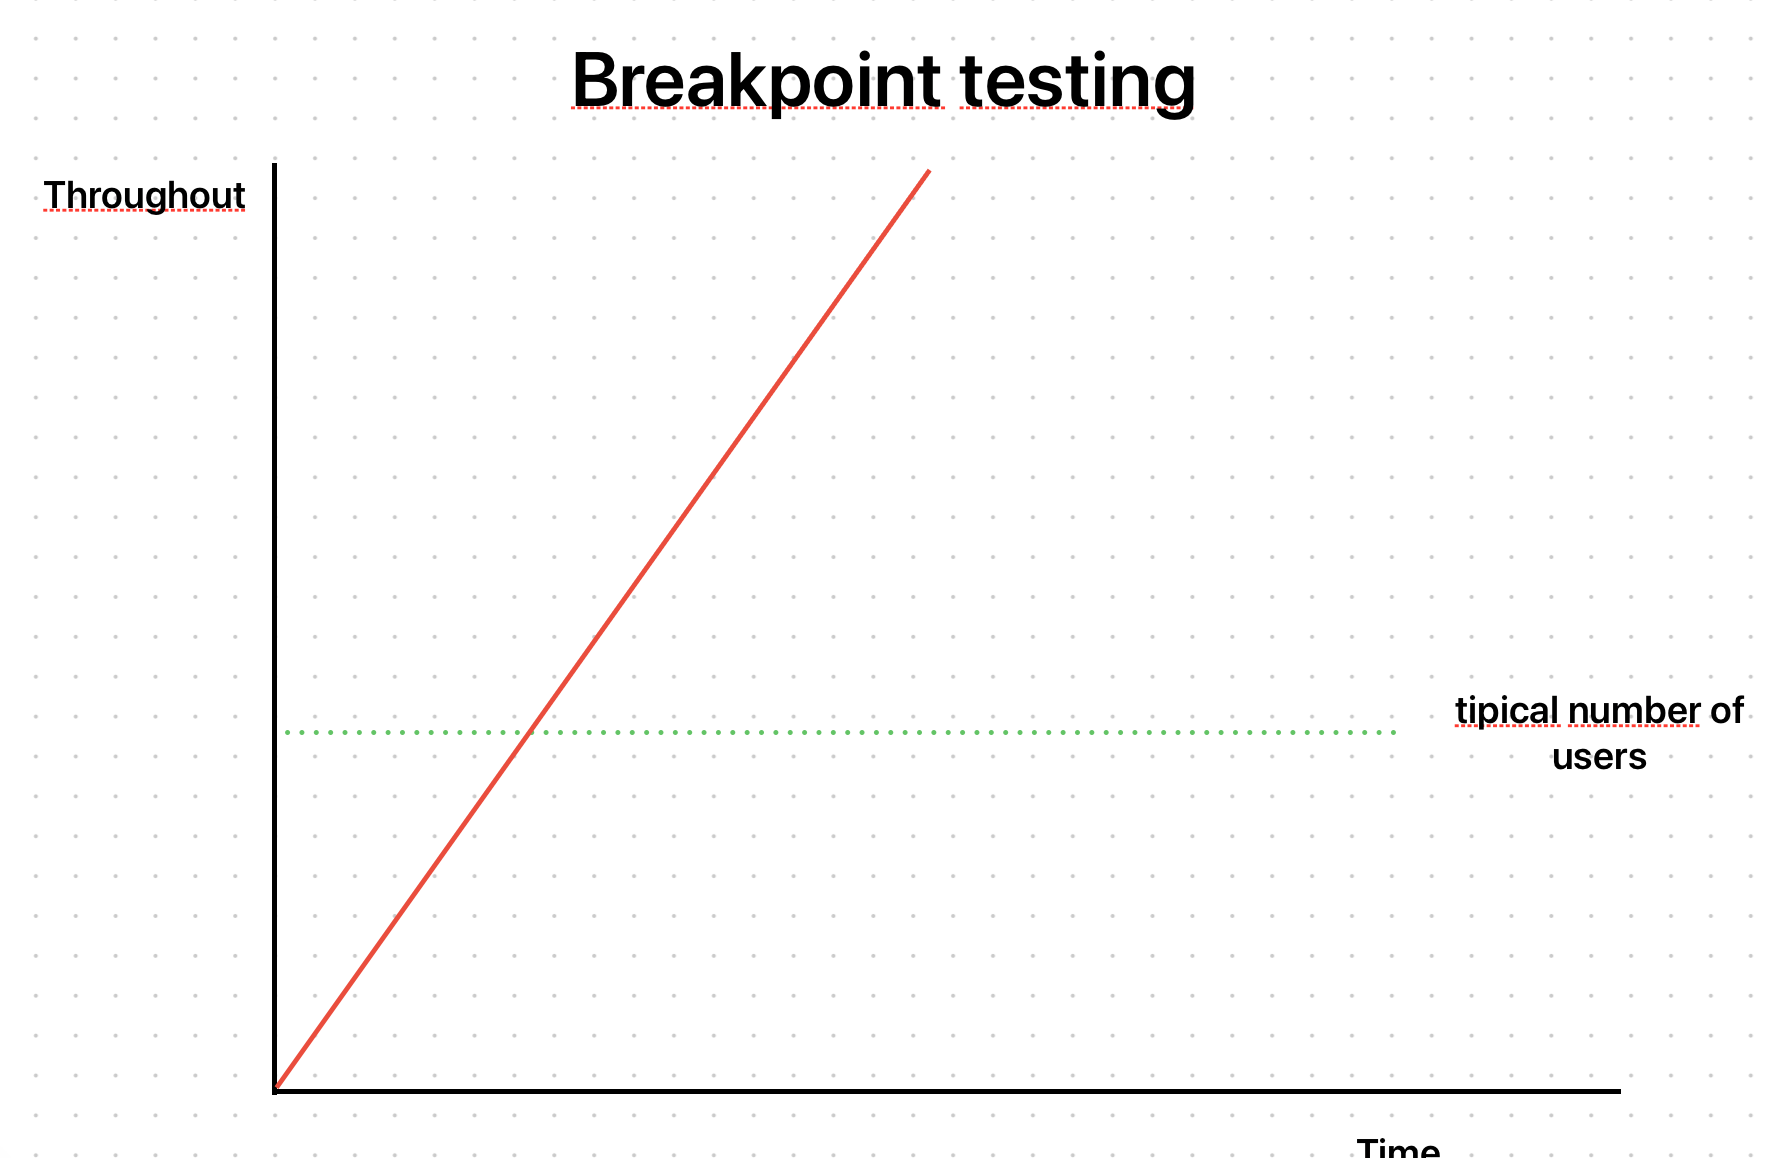
Breakpoint testing
Let's now observe the maximum limit that the application supports. To do this, we created the test to simulate the scenario:
import http from 'k6/http';
import { sleep } from 'k6';

export const options = {
    stages: [
        {
            duration: '2h',
            target: 100000
        }
    ]
}

export default function () {
    http.get('http://192.168.68.108:3000');
    sleep(1);
}
The breakpoint test is complex to observe with just the k6. Analyzing how the server and the application behave under pressure is necessary, using concepts of observability. By looking at the internal details of the application, we will be able to understand whether the breaking point is the server/cluster memory, whether it is the file system, the database, etc. I will not have data to show in the results of this test, as all these aspects are necessary for the application and infrastructure, and this is outside the scope of this post.
Soak testing
The idea of this type of test is to observe how the application behaves under constant pressure over a long time:
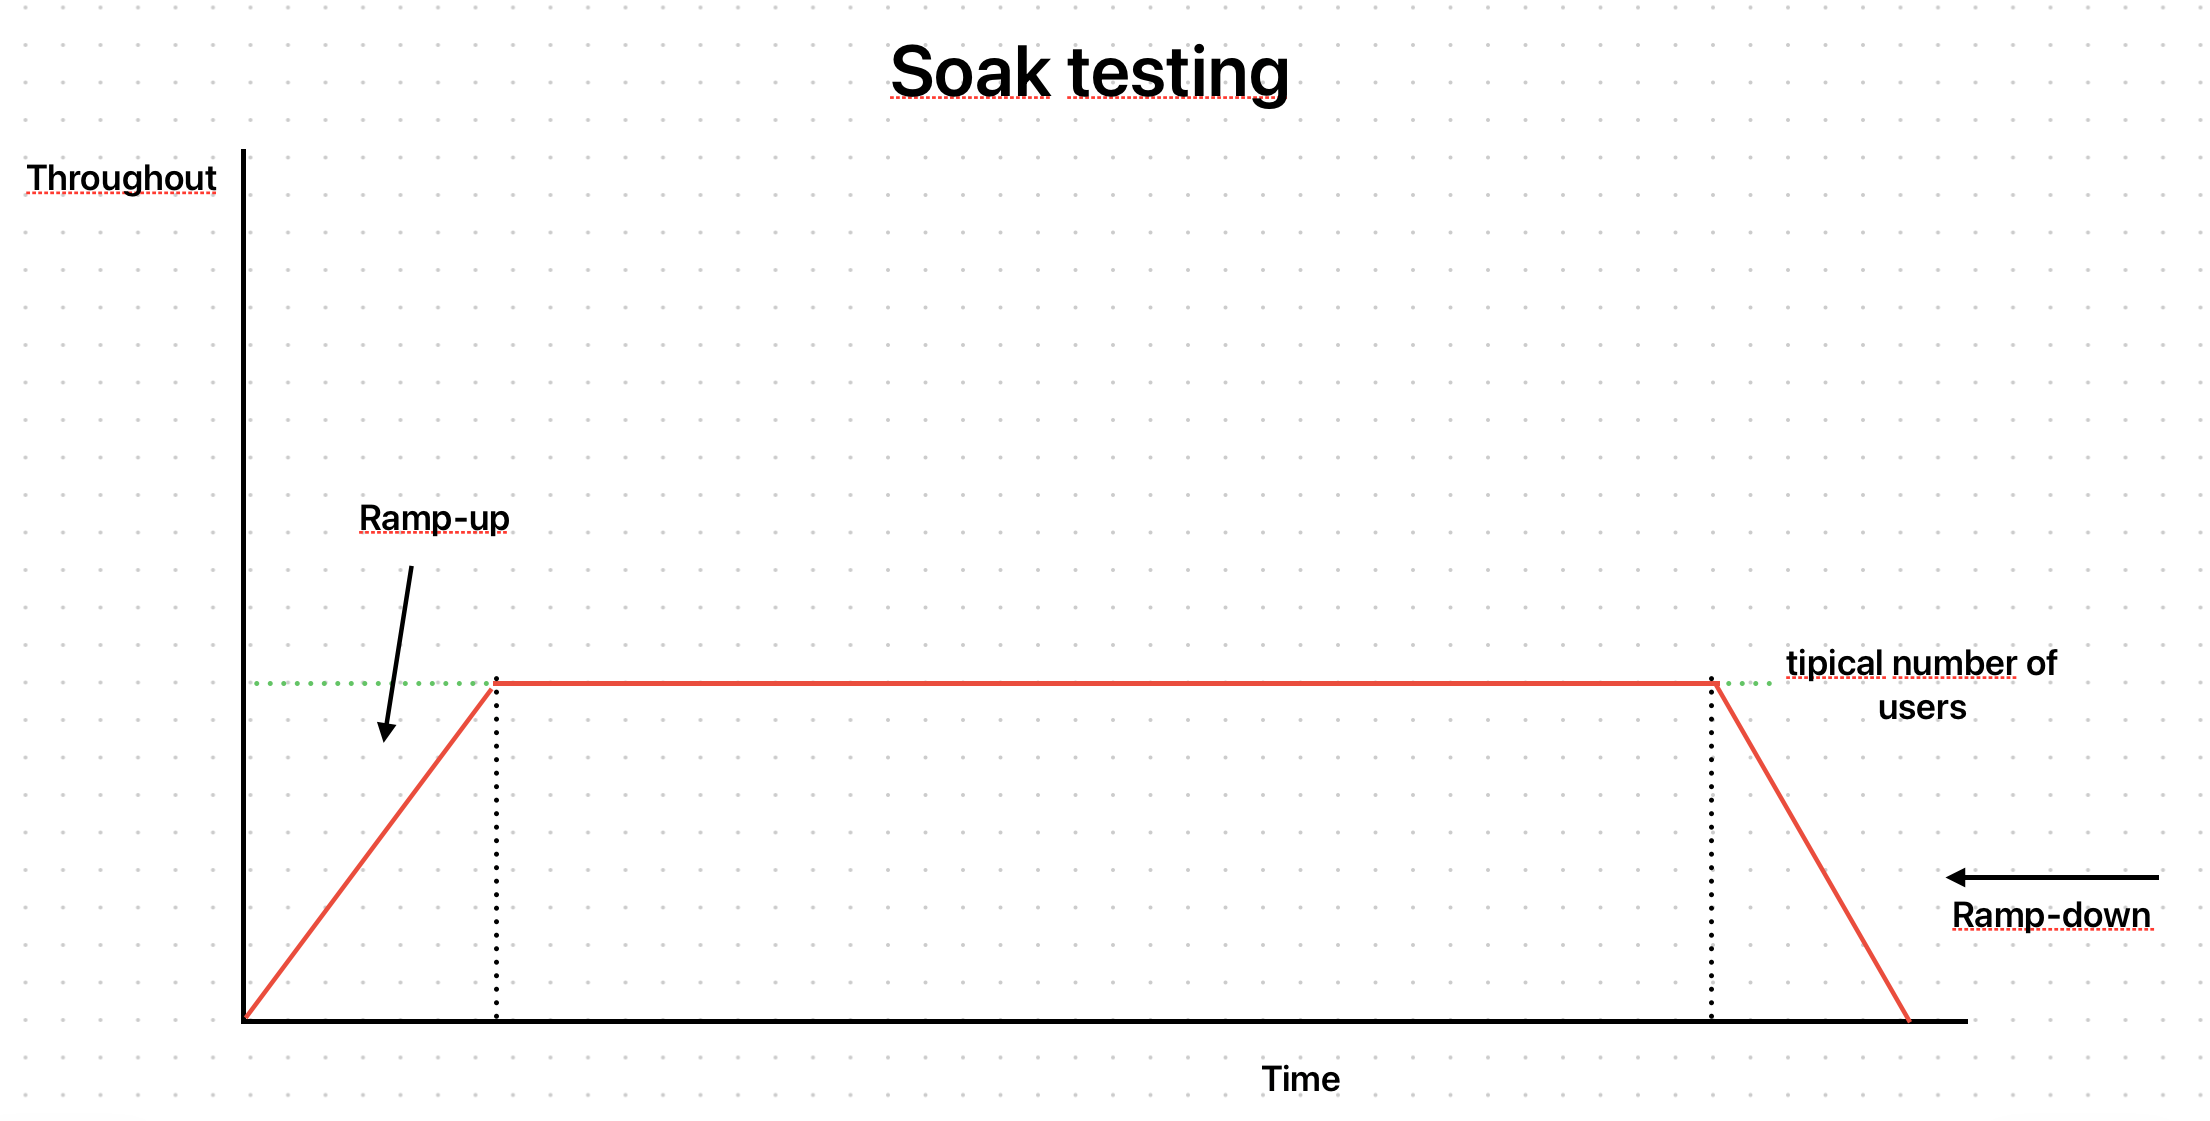
We can represent this scenario with the following test:
import http from 'k6/http';
import { sleep } from 'k6';

export const options = {
    stages: [
        {
            duration: '5m',
            target: 1000
        },
        {
            duration: '24h',
            target: 1000
        },
        {
            duration: '5m',
            target: 0
        }
    ]
}

export default function () {
    http.get('http://192.168.68.108:3000');
    sleep(1);
}
In the same way as the Breakpoint test, in this case, we also need to make use of observability to understand where problems begin to appear after some time under this constant pressure. Difficulties with memory leaks and exhaustion of resources such as memory, disk, database, and even network can occur.
Conclusions
This post aimed to materialize the concepts presented in the first part, demonstrating how to create tests using k6. I hope that with these first examples, the reader can apply these concepts in their environments to detect possible failures and be prepared for spikes in access, such as Black Friday, advertising campaigns, or even unexpected security attacks.
As further reading, I suggest:
- k6 allows you to create checks that will fail according to parameters such as request time, number of failures, etc. This check feature allows the k6 test to function as a performance/availability validation, and you can add it to your CI/CD.
- In addition to the open-source solution shown here, Grafana Labs provides a Cloud version of the product. With it, running tests from different sources and in the cloud is possible, ensuring a more advanced and complete test. Furthermore, it is possible to integrate test results into dashboards using the Prometheus + Grafana duo. This solution is SaaS and worth analyzing for more critical cases.
- I recommend reading the official documentation, as it contains more details on customizing the tests, results, and verifications.
Originally published at https://eltonminetto.dev on January 11, 2024

Top comments (0)