
This is part 4 of a 4 part series regarding how to create charts in Ionic 4 apps and PWA. In this Part 4, you’ll learn how to create various types of Charts using Google Charts.
(Part 1 — Adding Charts in Ionic 4 apps and PWA : Part 1 — Using Chart.js)
(Part 2 — Adding Charts in Ionic 4 apps and PWA : Part 2 — Using D3.js)
(Part 3— Adding Charts in Ionic 4 apps and PWA : Part 2 — Using HighCharts)
In these four posts, you’ll learn how to add and play with different types of charts in Ionic 4 apps. We will explore several alternatives for Charting i.e. Chart.js, D3.js, Highcharts, GoogleCharts and others.
Complete source code of this tutorial is available here — Ionic-4-google-charts
What is Ionic 4
I know most of the readers reading this blog will know what is Ionic 4, but just for the sake of beginners, I explain this in every blog.
Ionic is a complete open-source SDK for hybrid mobile app development. Ionic provides tools and services for developing hybrid mobile apps using Web technologies like CSS, HTML5, and Sass. Apps can be built with these Web technologies and then distributed through native app stores to be installed on devices.
In other words — If you create native apps in Android, you code in Java. If you create native apps in iOS, you code in Obj-C or Swift. Both of these are powerful, but complex languages. With Cordova (and Ionic) you can write a single piece of code for your app that can run on both iOS and Android (and windows!), that too with the simplicity of HTML, CSS, and JS. I’m a huge fan of Ionic and been developing Ionic apps for last 4 years.
What is Google Charts
Google Charts are yet another library to create easy charts in HTML5. From simple line charts to complex hierarchical tree maps, the chart gallery provides a large number of ready-to-use chart types. Compared to D3.js, it is a lot easier to create charts in Google Charts. It is almost similar as Chart.js, but a little less feature-rich compared to HighCharts.
The most common way to use Google Charts is with simple JavaScript that you embed in your web page. Hence, we can also use it very easily in Ionic apps. Google Charts also has several Angular wrappers available as open source libraries. We will use one such wrapper to import Google Charts in our app — ng2-google-charts
With Google Charts, you load some Google Chart libraries, list the data to be charted, select options to customize your chart, and finally create a chart object with an id that you choose. Then, later in the web page, you create a <div> with that id to display the Google Chart. Since, we are using ng2-google-charts for importing Google charts, we will be using <google-chart> element inside our HTML.
Among the advantages on Google Charts
- It has a wide variety of charts to select from
- The chart creation method is very easy, with data imported in
DataTableclass, so you can easily change the type of graph and check whichtypesuits your requirement best - Google Charts has the capability to create multiple Y axes for comparison etc.
- Unlike HighCharts, IT IS FREE !!! 😃

Structure of the post
We’ll go about the post in a step-by-step manner
- Create a basic Ionic 4 app
- Add Google Charts to the app
- Create your first basic Bar Chart with Google Charts — understand concepts
- Create simple Pie Chart with Google Charts
- Create more advanced charts
- Test your app on Android
Complete source code of this tutorial is available here — Ionic-4-Google Charts
Step 1 — Create a basic Ionic 4 app
I have covered this topic in detail in this blog.
In short, the steps you need to take here are
- Make sure you have node installed in the system (V10.15.3 at the time of this blog post)
- Install ionic cli using npm (my Ionic version is 4.12.0 currently)
- Create an Ionic app using
ionic start
You can create a sidemenu starter for the sake of this tutorial. On running ionic start ionic-4-google-charts sidemenu , node modules will be installed. Once the installation is done, run your app on browser using
$ ionic serve
The app will launch on browser. You can go to Inspect → Device Mode to see the code in a mobile layout. Next we’ll add the HighCharts library to our app.
Step 2 — Add Google Charts to the app
To create charts/visualizations you need to add Google Charts library to the app. Add the angular wrapper for google-charts from npm package
npm install ng2-google-charts --save
This will install the library in your node modules. Now you can import different modules of the library in your page using import syntax. The way this library works, you’ll have to import Google Charts in your page.module.ts using
import { Ng2GoogleChartsModule } from 'ng2-google-charts';
and also include Ng2GoogleChartsModule in the @NgModule imports.
That’s it ! You are ready to use Google Charts in your Ionic app and PWA pages.
Step 3 — Create basic Bar chart with Google Charts
Google Charts uses SVGs and HTML5 / CSS(internally) to create charts and visualizations in HTML5, just like HighCharts. The syntax of chart creation remains pretty much same across different types of charts. This is a cool feature, because now you can just change type and see which type of chart fits your data perfectly.
On the HTML side, you’ll need to create a google-chart component, which will accept [data]=”chartData” . You can check out more options for the <google-chart tag from ng2-google-chart documentation
The HTML will look like following for columnChart (barChart)
In bar.page.ts , we will assign all the chart data in columnChart1 variable to create the chart. First, we will import GoogleChartInterface in the ts file
import { GoogleChartInterface } from 'ng2-google-charts/google-charts-interfaces';
Now, the bar.page.ts will look like this after chart data assignment
Let’s look at the data and figure out what is happening here
- chartType — contains the type of chart, pretty self explanatory
-
dataTable — contains the actual data of the chart. It is in the form of an array with values as arrays itself. If you look at the above data, the first element of the array is defining the data labels. And that is the reason we have
opt_firstRowIsDataasfalseor disabled. If you have more than one series of data, you can simply put the data in the array format, increasing per element array members - options — deals with modifying almost everything else, such as axes, titles, label, heigh, width, trendlines etc.
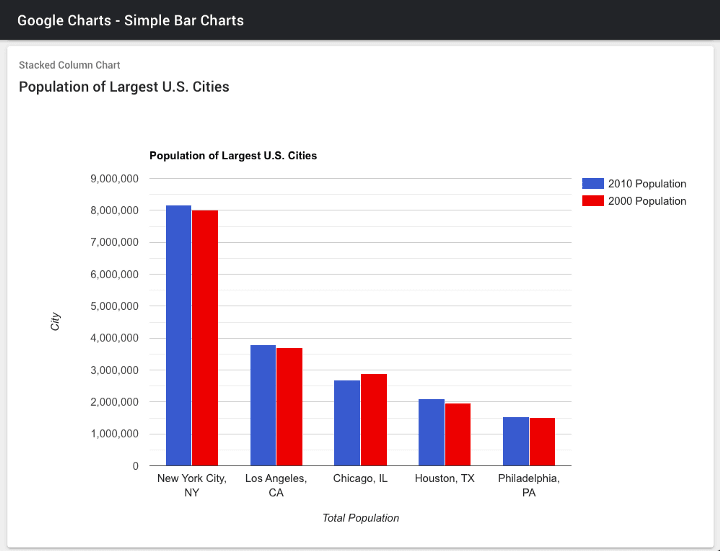
With the above code and data, our columnChart comes out like this

Grouped column chart
You can create more complex bar/column charts with Google Charts. E.g. to create a grouped Column Chart, you need to modify the dataTable as
As you can see, we just added another series data within the same array. The result looks like this
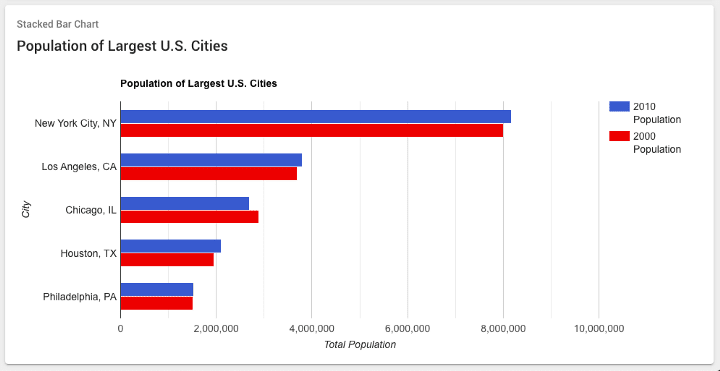
Horizontal Pie Chart
Simply change the chartType to barChart and you’ll get a horizontal bar chart with the same data
Step 4 — Create basic Pie chart with Google Charts
Pie chart creation is very similar to Bar chart in Google Charts. Simply change the data in dataTable and change the chartType , and you are good to go.
My pie.page.ts looks like following for creating a pie chart with Google Charts
The Pie chart will look this
There are other cool features you can implement in pie charts using Google Charts like
3D Pie Chart
Just add is3D: true in the chart options and your pie chart will turn 3D

Exploded Pie Chart
Just add offset values for each of the slice of pie chart, and you’ll get an exploded view of pie chart. The offset can be given in chart options in this format
slices: {
1: { offset: 0.3 },
2: { offset: 0.2 },
3: { offset: 0.3 },
4: { offset: 0.1 },
},
...
The exploded Pie chart will look like following

Donut Chart
Another kind of pie chart is a donut chart, where there is a hole in the middle. You can simply add pieHole property in chart options and you’ll get a donut chart as a result. For a pieHole: 0.4 , this is how the chart looks

Step 5 — Create basic Line charts with Google Charts
Creating scatter chart in Google Charts is again as easy as creating any other chart. Just change the type to LineChart and you are good to go.
Just for an example, a simple line chart creation code will look like following
Notice, this time I have opt_firstRowIsData: true , because I have data in the array’s first row as well.
The resultant chart looks like following

Grouped Line Chart
Simple add another data series in the dataTable array, and you got yourselves a grouped line chart
and the resultant Chart

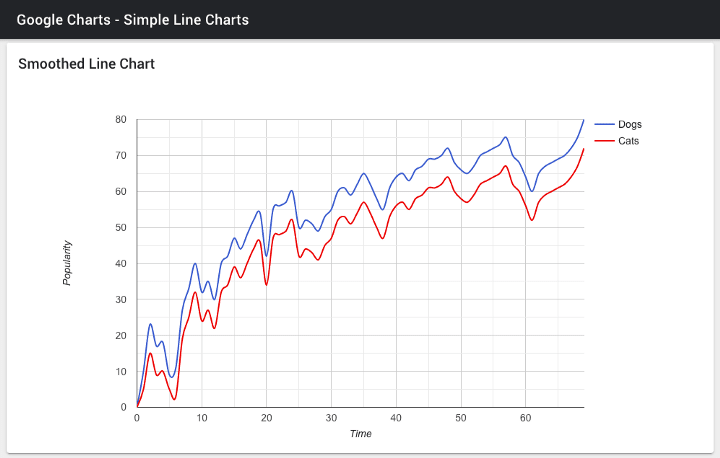
Smoothed out Line Chart
If you want the line chart smoothed out, you can use
curveType: 'function',
in chart options . The resultant chart for the same data as above will look like this
Line Charts with Trendlines
Introducing trendline in charts is very easy in Google Charts. Just include one trendline object per data series in chart options and you can get multiple trendlines in the chart.
E.g. For the above data, I am going to have a linear trendline for Series Dogs and exponential trendline for Series Cats
Just add the following in options
trendlines: {
0: { type: 'exponential', color: '#333', opacity: 1 },
1: { type: 'linear', color: '#0f0', opacity: .5 }
}
You’ll get two trendlines in the chart like this

Step 6 — Create Scatter charts with Google Charts
Once again, you just need to change the chartType (“ScatterChart”) and set your data in dataTable array to get a scatter chart.

Custom Scatter Chart
You can change scatter chart points and colors to give it custom appearance. E.g. just add the following in chart options
colors: ['#ff0000'],
pointShape: 'star',
pointSize: 18,

Trendline in Scatter Charts
As we created trendline in Line Charts, we can create trendlines in Scatter charts as well. Just adding the following in chart options
trendlines: {
   0: { type: 'exponential', color: '#333', opacity: 1 }
}

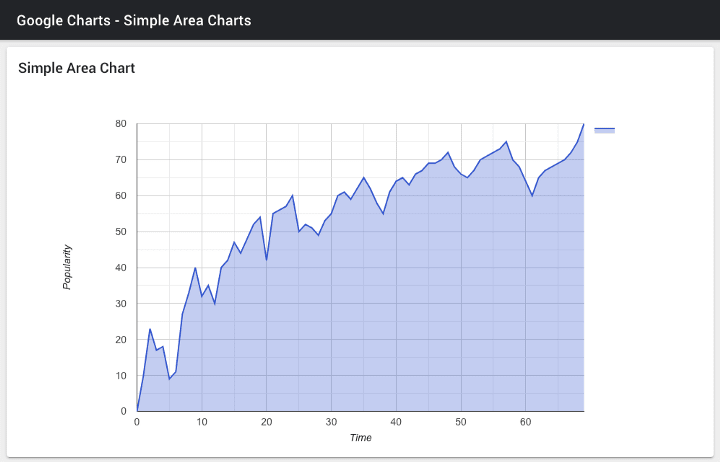
Step 7 — Create Area Charts with Google Charts
Area charts follow almost same methods as Line charts, the only difference being chartType:'AreaChart'
Here are the results
Simple Area Chart
Grouped Area Chart

Step 8— Test your app in Android and as PWA
We have already tested the above Google Charts in browser. If you have carried out the above steps correctly, Android build should be a breeze.
Run the following command to create Android platform
$ ionic cordova platform add android
Once platform is added, run the app on device (Make sure you have a device attached to the system).
$ ionic cordova run android
Once your app is up and running on the device, you can start testing all the functions.
Other cool charts possible in Google Charts
Google Charts has many other features and types of charts which you can create as easily as you created the above charts. I haven’t included these in the open source, but you can always refer Google Charts Documentation to create these charts
Bubble Charts
Along with simple bubble charts, you can also create packed bubble charts like this one

Calendar Charts

CandleStick Chart

Combo Chart
You can combine multiple charts in Google Charts as well, similar to Chart.js, or HighCharts.

Gauge Chart

GeoChart
Because of the Google Map capability, Google Chart has the powerful feature of creating Geocharts, similar to D3.js

There are many more types of charts you can create with Google Charts. Just head over to the documentation and explore !
Conclusion
In this post we learnt how to create simple and complex charts using Google Chart in Ionic 4 apps and PWA. Since Google Charts is very easy to implement, you need to take very little effort to create a large variety of charts. The documentation on Google Charts website is good enough to simulate any type of chart in your projects.
We looked at the following types of charts in this post
- Bar charts — Horizontal, vertical, grouped
- Line charts — Simple, grouped, smoothed, with trend-line
- Area chart — Simple, grouped
- Scatter chart — Simple, custom, with trend-line
- Pie chart — Simple, 3D, donut and exploded
Complete source code of this tutorial is available here — Ionic-4-google-charts
Also check out other posts of this series,
(Part 1 — Adding Charts in Ionic 4 apps and PWA : Part 1 — Using Chart.js)
(Part 2 — Adding Charts in Ionic 4 apps and PWA : Part 2 — Using D3.js)
(Part 3 — Adding Charts in Ionic 4 apps and PWA : Part 2 — Using HighCharts)
— — — — — — — — — — — — — — — — — — — — — — — — — — -
Buy “Ionic 4 Chart App Starter — Ion Chart” today!!
— — — — — — — — — — — — — — — — — — — — — — — — — —
Next Steps
Now that you have learned the implementation of Google Charts for charting in Ionic 4, you can also try
- Ionic 4 PayPal payment integration — for Apps and PWA
- Ionic 4 Stripe payment integration — for Apps and PWA
- Ionic 4 Apple Pay integration
- Twitter login in Ionic 4 with Firebase
- Facebook login in Ionic 4 with Firebase
- Geolocation in Ionic 4
- QR Code and scanners in Ionic 4 and
- Translations in Ionic 4
If you need a base to start your next Ionic 4 app, you can make your next awesome app using Ionic 4 Full App


Top comments (0)