Profiling your Website with Craft CMS 3’s Debug Toolbar
Craft CMS 3 has some big changes under the hood, one of which is the addition of the Debug Toolbar that helps you profile and debug your websites
Andrew Welch / nystudio107

With Craft CMS 3’s official release on April 4th 2018 behind us, people are diving in and starting to get acquainted with what’s new in Craft CMS 3.
The Craft 3 Beta Executive Summary and Setting up a New Craft CMS 3 Project articles cover this from a gestalt perspective. In this article, we’re going to delve into a specific topic: the all new Debug Toolbar.
In Craft 2.x, we got used to looking at the web console to see debugging & performance information on our website. In Craft 3, this has been vastly improved by consolidating all of it into the Debug Toolbar.
The Debug Toolbar is actually coming from Yii2, with some extra magic layered on top by the Pixel & Tonic folks. Best of all, it’s searchable, sortable, and infinitely more useful than the old Craft 2.x method of dumping information to the web console.
Here’s what it looks like:

Enabling the Debug Toolbar
So how do we get this wonderful little beast to appear for us?

Next, you need to specifically enable the Debug Toolbar. This is done on a per-user basic, so we’ll need to go to our My Account page in the AdminCP:
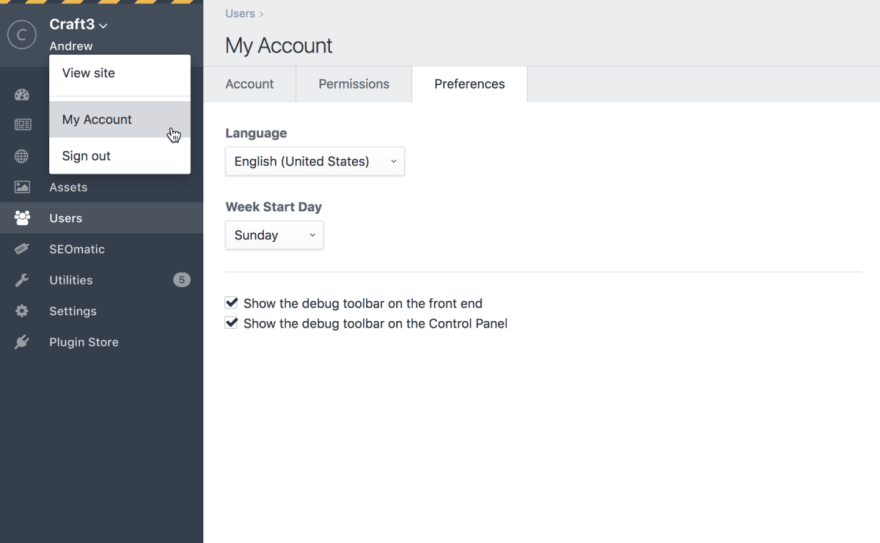
Once you’re on the My Account page, click on the Preferences tab, and then check the Show the debug toolbar on the front end and/or Show the debug toolbar on the Control Panel checkboxes, depending on where you want the toolbar to appear.
That’s it! You should now have the fancy new Debug Toolbar ready and waiting to help you out.
Since the preference to show the Debug Toolbar (or not) is tied to your account, you obviously have to be logged in as well. So if it is mysteriously not showing up for you, ensure that you’re still logged in!
Note that if devMode is not on, you can still use the Debug Toolbar, but not as much information will be logged. Only error and warning messages as well as timing profiling information will be logged if devMode is not on.
So what kinds of things can the Debug Toolbar do for you? Read on to find out, we’ll cover a few useful things it can do for you!
Profiling Database Queries
Now that we have the Debug Toolbar up and running, let’s use it for a very common use-case: profiling database queries.

We want our sites to be performant as discussed in the A Pretty Website Isn’t Enough article; and a good start is cutting down on the number of database queries we’re making.
Clicking on the DB section of the Debug Toolbar brings up the Database Queries panel:
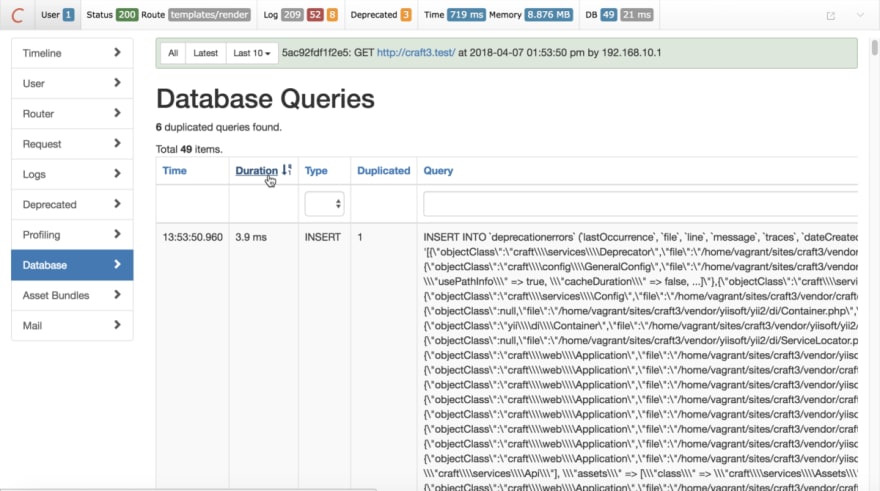
Here we can look at all of the database queries that happen when loading the webpage. While we want to reduce the number of queries as much as possible by utilizing techniques such as caching and eager loading, we want to focus on the queries that take the most time.
The nice thing about the Debug Toolbar is that we can sort the queries by Duration to find the non-performant queries that we should be focusing on.
This sure beats paging through each query one by one: we can focus on the queries that matter instead.
Pro tip : scroll all the way to the bottom of the page, and click on the Explain all link, and you’ll see a human-readable summary of each query:

Sifting Through Logs
If you’ve done any amount of Craft CMS 2.x development, you’ve spent at least some time reading through the craft.log to figure out what’s going wrong. Thankfully, the Debug Toolbar makes this easier too!

Clicking on the Logs section of the Debug Toolbar brings up the Log Messages panel:
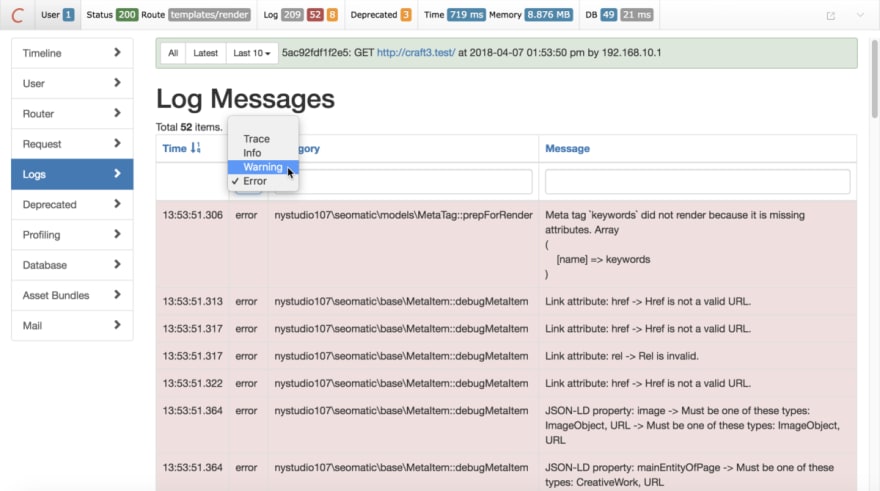
All of the logging in Craft CMS 3 goes into one primary log file now, web.log, and the Debug Toolbar lets you filter through it all. Everything Craft logs, as well as everything plugins log is all in one place in the Debug Toolbar.
You can choose what type of log messages to view, from least severe to most severe:
- Trace — Log messages that show the flow of the app
- Info — Informational messages
- Warning — Warning messages about things that could be problematic
- Error — Hard errors, things that are flat out wrong
By limiting the type of log messages displayed, you can find the important problems much easier. In the Debug Toolbar itself, Info = grey, Warning = orange, Error = red.
You can also further filter the messages by Category by typing in the text box below it:
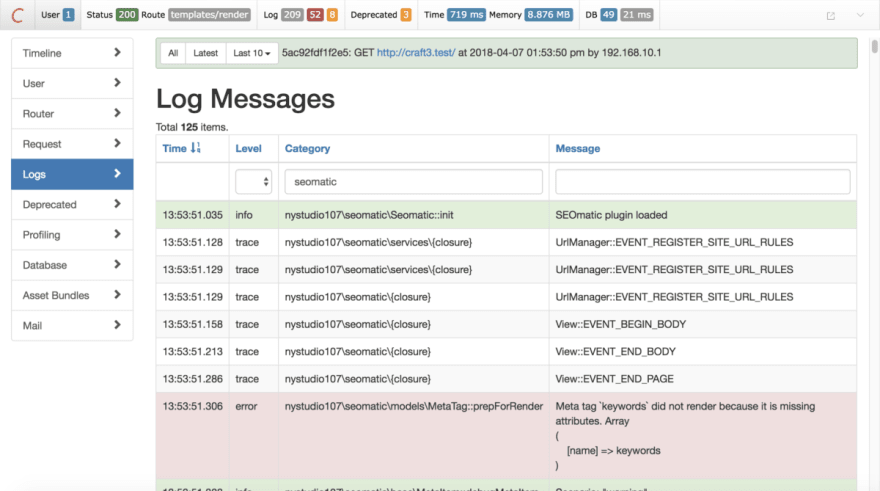
This lets you very quickly search through the copious logging that Craft does to quickly find what you’re looking for.
So much nicer than paging through a monolithic log file in a text editor.
Pro tip: if you click on the C icon at the far left of the Debug Toolbar, it’ll go full screen so you can see more information.
Overall Performance Profiling
The Debug Toolbar also has some pretty amazing performance profiling tools that let you see exactly what’s happening when your webpages are loaded.

Clicking on the Time section of the Debug Toolbar brings up the Performance Profiling panel:
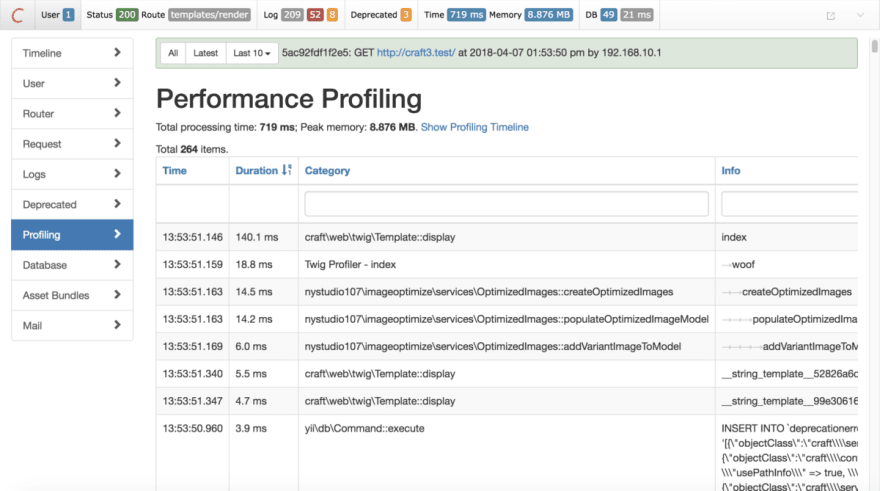
Here you can see the overall time that the page took to load, as well as the peak memory usage while the page was loaded.
You can also see the performance timings broken down in a more finely grained manner, and you can sort by Duration or filter by Category , just as you can in other parts of the Debug Toolbar.
The data shown in the Info column on the right will be indented to show its nesting level.
Clicking on Timeline on the left brings up a visual display of how your webpage loads:

This gives you a really nice visualization of how your page loads; and you can filter the Duration by 10ms or so, in order to see only the things that take a significant amount of time.
Twig Template Performance Profiling
All of this profiling is pretty amazing, but it’s only showing us profiling information that Craft or plugins might be recording. What if we wanted to profile our own Twig templates? Read on!

Often times we might want to profile specific sections of our Twig templates. To make this possible, I created a free Craft CMS 3 plugin called Twig Profiler that allows you to wrap chunks of code that you want profiled:
{% profile "woof" %}
    {# code goes here #}
{% endprofile %}
Just install the Twig Profiler plugin via the Plugin Store in the Craft CMS 3 AdminCP, and away you go!
The parameter you pass in (woof in the above example) should be unique per profile block, so you can identity it when looking at the profiling data.
Reload your page, and then click on the Time section of the Debug Toolbar, and you’ll see your profile data:

The Category will always have Twig Profiler listed in it, so you can filter on that to find your profiling data quickly. Twig Profiler will also append the name of the currently rendering template, to give you some additional context.
Clicking on the Timeline section on the left will show you a visual timeline of the profile data:

You can have as many {% profile %} block tags a page as you like, and they can wrap around any Twig code you like (include, block, whatever). You can also nest {% profile %} block tags as much as you like.
A good approach is to include {% profile %} tags in all the {% block %} tags in your layout templates, so that you’ll automatically be profiling your templates.
You can add more fine-grained {% profile %} tags in your templates as needed.
Since the tags add little to no overhead, there’s no harm in having them there. Then if you do have performance issues, you’ll have the requisite profiling data at your fingertips.
Under the hood, it uses the exact same method that Craft/Yii2 use to record profiling data.
Another tool that can be helpful for diagnosing Twig templates is a free Craft CMS 3 plugin we created called Template Comments. This plugin adds a HTML comment with performance timings to demarcate {% block %}s and each Twig template that is included or extended:
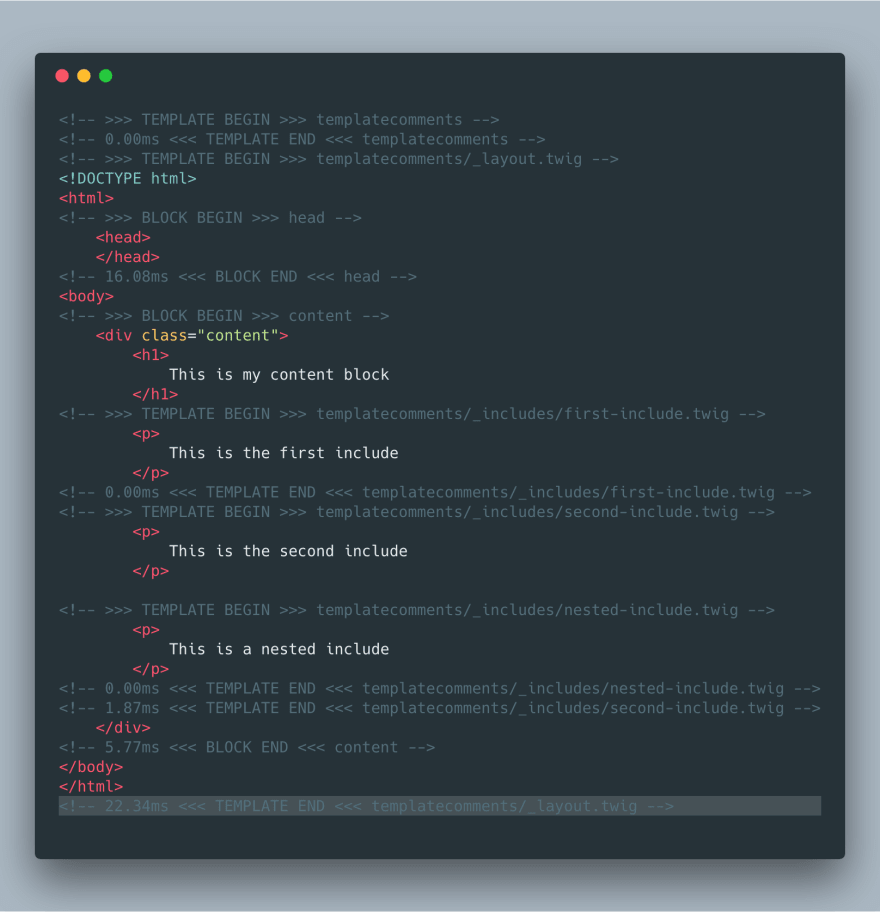
Just install the Template Comments plugin via the Plugin Store in the Craft CMS 3 AdminCP, and it’ll automatically start adding these HTML comments to your templates in local dev. If devMode is off, it doesn’t even install itself.
In addition to the performance timings, the comments that delineate each {% block %} and template that is included makes it easier to track down what is coming from where.
Plugin Developers
If you’re a plugin developer, do yourself (and your users!) a favor by wrapping important chunks of code with:
Craft::beginProfile('someUniqueIdentifier', __METHOD__ );
// Insert code here
Craft::endProfile('someUniqueIdentifier', __METHOD__ );
This allows you to assess the impact of your plugin on the performance of the page loads. It’s simple, easy to do, and future-you will thank yourself for doing it.
This is the exact method that Craft/Yii2 and also Twig Profiler uses to log profiling data.
Check out the Performance Profiling section of the Yii2 docs for details.
Wrapping Up
The Debug Toolbar can be an enormous help in understanding how your webpages are loading; and it does even more than described here.
Hopefully this introduction has given you enough to get you up and running.
Happy profiling!
Further Reading
If you want to be notified about new articles, follow nystudio107 on Twitter.
Copyright ©2020 nystudio107. Designed by nystudio107

Oldest comments (0)