GISBox Official Teams: https://teams.live.com/l/invite/FEAr12sInvEVy4hFQE
Official Teams Group: https://teams.live.com/l/invite/FBAFp0pbqhqlpe1BQI
In the field of environmental monitoring and research, GISBox plays an essential role in the work of environmental modelers as an efficient GIS tile generation and visualization software. GISBox enables rapid processing and visualization of large-scale spatial data, greatly improving work efficiency and accuracy in environmental simulation, data integration and analysis, model verification and optimization.
- Improved efficiency of environmental data processing and visualization Environmental modeling requires processing large amounts of spatial data, such as satellite remote sensing images, meteorological data, DEM (digital elevation model), and land use data. Traditional GIS software may experience slower loading speeds and performance limitations when processing large amounts of data. On the other hand, GISBox has a highly efficient tile generation function, and by tiling large amounts of environmental data into lightweight 3D Tiles and b3dm formats, it is possible to display them quickly and smoothly on the web.
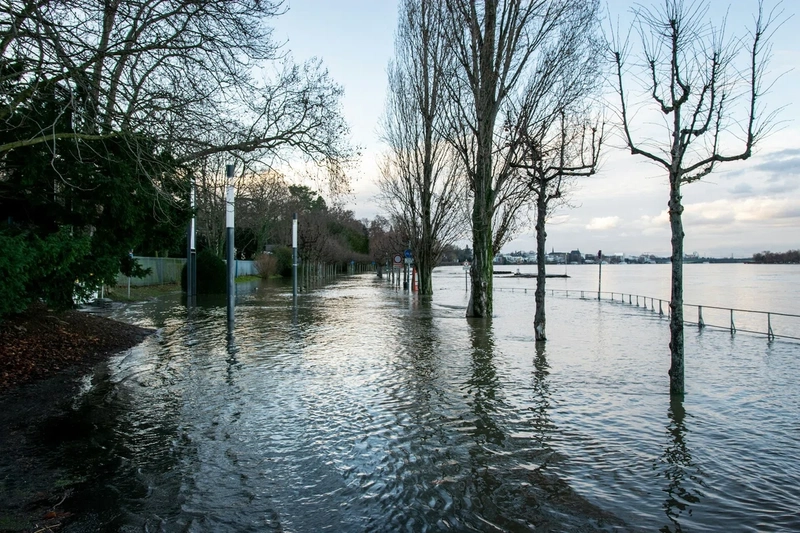
For example, in flood diffusion simulation, a variety of remote sensing images and DEM data are loaded to display water level changes and flood diffusion processes in a 3D environment. By tiling data with GISBox, the loading speed is significantly improved, and operations on the web are smooth and responsive. This makes it easy to quickly verify model calculation results and adjust parameters.
- Supports the construction and analysis of environmental models Environmental models require analysis that combines multiple data sources such as land use, topography, meteorological data, and pollution source distribution. GISBox supports seamless integration with major GIS platforms (ArcGIS, QGIS, etc.), allowing you to quickly integrate and visualize environmental model output data with other GIS data.
For example:
In a climate change model, raster data of temperature and precipitation generated in Python is imported into GISBox and overlaid with land use data. The impact of climate change on agricultural areas and urban heat islands can be visualized in a 3D scene.
In atmospheric diffusion model research, GISBox displays pollutant diffusion data and meteorological data such as wind speed and direction in a time-series animation. This visualization makes it easier to identify pollution sources and evaluate the extent of their impact.
- Supports the sharing and publication of environmental data The results of environmental model research need to be made available to government agencies, companies, and the general public. GISBox is equipped with a web publishing function, which allows you to publish the visualization results of 3D environmental models as web services with one click and generate links that can be accessed online.
For example:
In an urban environmental risk assessment project, the heat island phenomenon distribution map and air pollution diffusion map simulated by the model are loaded into GISBox and published as web services. Government officials can view the model results directly from their browsers without having to install special software.
In environmental education and outreach activities, climate change simulation data and geographic data are integrated and visualized in GISBox to generate interactive scenes. This makes complex environmental change information easy to understand for the general public.
In conclusion
In the daily work of environmental modelers, GISBox significantly improves work efficiency and accuracy with its fast data tile generation and visualization functions. This makes it possible to process large-scale data and visualize model simulation results quickly and intuitively. In addition, efficient publishing and sharing on the web also contributes to environmental risk assessment, decision-making support, and outreach activities. GISBox has become an indispensable technical tool in the field of environmental change simulation and monitoring.


Top comments (0)