Introduction
Matplotlib is one of the most popular python libraries for data visualization, but new users may have difficulties getting started. When I first started using matplotlib, I found plt and axes to be the two most confusing concepts. So this article will discuss how to use plt and axes.
Plot Single Graph
# Import libraries
import matplotlib.pyplot as plt
import numpy as np
When you want to draw a single graph, you can use plt.plot() directly, but of course, using plt.subplots() is also OK.
The following two methods will produce the same results:
1.Using plt.plot() directly
plt.plot(np.random.rand(10))  # 10 random number between [0, 1)
plt.title("title")
plt.show()

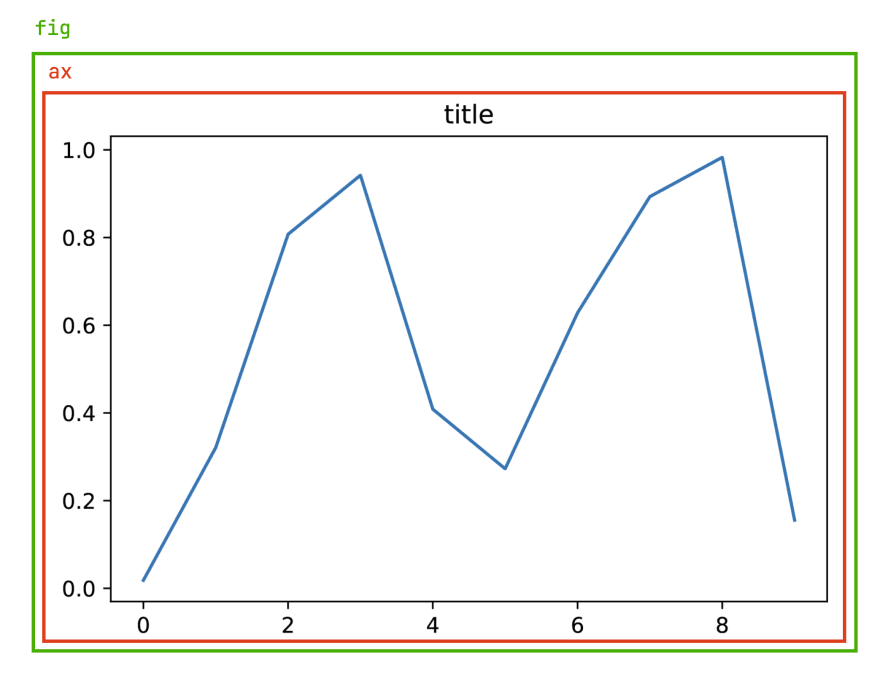
2.Using plt.subplots()
fig, ax = plt.subplots()  # Create a figure and a set of subplots.

ax.plot(np.random.rand(10))
ax.set_title("title")
plt.show()
Plot Multiple Graphs
When you want to draw multiple graphs, you should use plt.subplots().
# 2x2, a total of 4 graphs
n_rows = 2
n_cols = 2

fig, axes = plt.subplots(nrows=n_rows, ncols=n_cols)  # Create a figure and subplots of size 2x2

for row_num in range(n_rows):
    for col_num in range(n_cols):
        ax = axes[row_num][col_num]
        ax.plot(np.random.rand(10))

fig.suptitle("main title")
fig.tight_layout()  # Smaller padding
plt.show()


Top comments (0)