


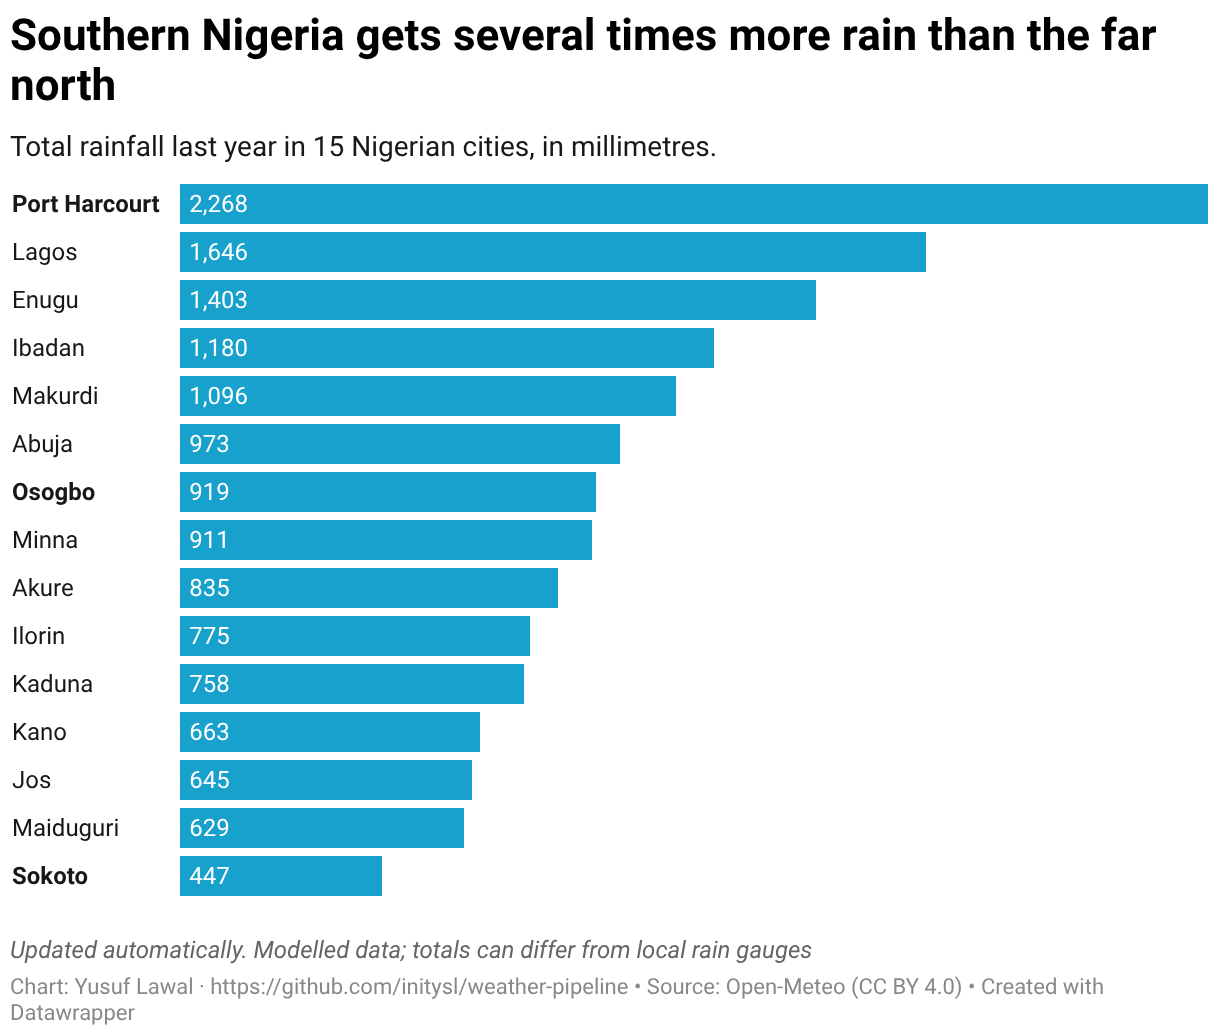
Last year Port Harcourt got 2,268 mm of rain. Sokoto, about 900 km north, got 447 mm. That's five times as much rain, in the same country, in the same year.

Total rainfall last year. Live chart
If you advise farmers when to plant or how much to irrigate, a national average is useless. You need local weather, every day, and you need to trust it. That's what this project provides.
What I built
I framed the project around a hypothetical agritech startup that sends planting and irrigation advice to farmers. Its analysts need one table of daily weather for every city the company serves, so they can answer questions like:
- How many rainy days did Kano get this month?
- Is Osogbo hotter than usual this week?
So I built a data pipeline that collects that weather automatically, checks it, stores it in a database and turns it into ready-made summaries and live charts. Nobody has to run anything by hand.
What it does
Updates itself. It runs three times a day on GitHub Actions and always brings the table up to date with yesterday's weather.
Covers the whole country. 15 cities, from the dry Sahel (Sokoto, Maiduguri) through the middle belt (Abuja, Jos, Makurdi) to the Niger Delta (Port Harcourt), with daily history back to January 2024.
Grows with one command. Any Nigerian town can be added by name: the pipeline finds its coordinates and loads its history automatically.
Keeps the data correct. Every value is checked before it's stored. Impossible readings, such as 60 °C or negative rainfall, are flagged and left out, never silently kept.
Never duplicates. However many times it runs, there is exactly one record per city per day.
Fills its own gaps. Each run reloads the last seven days, so if a run is ever missed, the next one catches up.
Publishes live charts. After every run it updates three public charts, with no manual work.
How it helps
Analysts get answers instead of raw data. Three summaries sit on top of the daily table.
Monthly summary: average temperatures, total rainfall and the number of rainy days for each city, each month. That makes "how many rainy days did Kano get this month?" a one-line query.
The rainy season, city by city. The table below shows how the rainy season arrives in the south first and lasts longer there. Last year Sokoto had rain almost only from June to October, while Port Harcourt had rainy days in every month. That's the difference between a short planting window and a long one.

Rainy days per month, last year. Live chart
Hotter than usual? Each city's last seven days are compared with its normal temperature for the same month in previous years. This is the kind of signal that tells an advisor when crops may need more water than usual.

Snapshot from the day of publishing; the live chart updates daily.
Because the data is checked and never duplicated, analysts can trust these numbers without cleaning them first.
How it's built

- Schedule: GitHub Actions starts the pipeline three times a day
- Extract: Python fetches all cities from Open-Meteo in one request
- Transform: pandas cleans the data and checks every value
- Load: rows go into PostgreSQL (Neon) in batches
- Serve: SQL views and the live charts refresh
Tech stack: Python, pandas, PostgreSQL, SQLAlchemy, Docker for local development, GitHub Actions for scheduling and tests, Datawrapper for the charts.
A few design choices do most of the work:
Safe to re-run. Every load is an upsert (INSERT … ON CONFLICT DO UPDATE) on city and date. The database itself refuses a second record for the same city and day, so a run can be repeated as often as needed.
A rolling seven-day window. Daily runs reload the last week rather than only yesterday. Together with the upsert, that's what makes the pipeline fill its own gaps.
Two data sources. History comes from Open-Meteo's archive; the latest days come from its forecast service, which covers the few days before the archive catches up.
Cities are data, not code. The list of cities lives in the database. Adding a town is a command, not a code change, and a town can be paused without losing its history.
Built for the cloud. Rows are written in batches of up to 1,000 so loading stays fast over the internet, every request has a hard time limit, and anything that fails is retried automatically.
Charts that update themselves. After each run the pipeline exports three small CSV files to a branch of the repository, and the charts read them from there.
Tested on every change. Automated tests run on every push, including a check that loading the same data twice changes nothing.
The weather values come from Open-Meteo's models (free for non-commercial use, CC BY 4.0). They describe each city's location on a 10–25 km grid, so they can differ from a local rain gauge.
Try it
The code, setup steps and links to all three live charts are on GitHub:
 initysl
/
weather-pipeline
A daily data pipeline that keeps a clean, trustworthy weather data.
Nigeria Weather Pipeline

A daily data pipeline that keeps a clean, trustworthy weather table for 15 Nigerian cities. It's built for an agritech startup whose analysts turn weather into planting and irrigation advice for farmers. It answers questions like:
- How many rainy days did Kano get this month?
- Is Osogbo hotter than usual this week?
Live charts, updated by the pipeline: Annual rainfall · Rainy season by month · This week vs normal
What it does
- Updates every morning: fetches yesterday's weather early each morning (Lagos time), automatically.
- Covers the whole country: 15 cities from the dry Sahel (Sokoto, Maiduguri) to the wet Niger Delta (Port Harcourt), and any Nigerian town can be added with one command.
- Keeps the data correct: every value is checked before it's stored, and suspect readings are flagged, not silently kept.
- Never duplicates: re-running a day, or a whole year, always leaves exactly one record…
Next, I'm adding state-level averages built from several towns per state. And if there's a Nigerian town you'd like to see tracked, tell me: adding one is a single command.


Top comments (0)