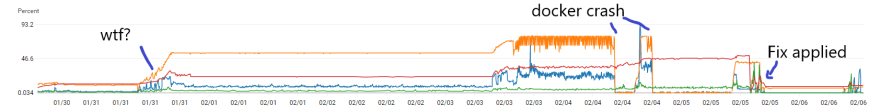
One day whilst our app was running in the QA environment we saw what you see on the left half of this graph, let me explain the lines and what they mean
There are two apis in play here, let's call them Api 1 and Api 2
Orange line: Api 1 Memory usage as a %
Red line : Api 2 Memory usage as a %
Blue line: Api 1 CPU utilisation as a %
Green line: Api 2 CPU utilisation as a %
Note: Before I continue I wanted to make a few notes:
- I hope you can appreciate that I cannot show you the original code I was working with as it belongs to a private company, so I've had to create a slim representation of the issue
- There are many reasons why "memory leaks" can occur and not all scenarios are the same
- Handling "memory leaks" like this is tough, it took me a couple of days to track this down and even the it took a deep understanding of what I was looking at, the code that was running and the tools
Absolute MAD shoutout to Jetbrains, I am in no way affiliated with this company, but I used theyre tools (paid for by he company I work for). They have a suite of tools to help with coding, memory, performance.
If you've never heard of Resharper or DotMemory or DotTrace, or even DotPeek that decompiles code you are doing yourself a HUGE disservice as a .Net developer, please if you take ANYTHING away from this blog post go check these guys out
JetBrains
So let's actually start talking about things shall we...
The steady climb
At the very left of the graph on the top of this post we can see the memory utilisation of both of the apis were climbing steadily.
- So what was happening here?
We had absolutely no idea, it was a big REST based API so we were at a loss for any suggestions, so we decided to spin up a task to investigate.
Now for the very few of you that have worked with me or know me in person i despise this type of story, because in my opinion there are
- No good acceptance criteria that you can set
- There are no good ways of managing your time
- These tasks an spiral so easily
The issue with timeboxing
I often hear that "timeboxing" can be the solution here, which is esentially let someone look into it for x amount of hours or days depending on size.
But my question is... What if you can't find the issue? What if you just end up chasing ghosts for all or most of your time? Or even worse, what if your on the verge of making a breakthrough do you follow it through?
It's just so hard to judge.
Knowledge is power
This is not an excuse for my abilities, but I will mention here that I was pretty new to the codebase at the time of looking into the issue and felt that someone ele woul have been better positioned to investigate the issue, but timing and cicumstance landed it at my doorstep. So I rose to the occasion.
I think this is an important lesson to take away - you can make all of the suggestions, potests and objections in the world, but sooner or later you will have to like it or quit. You have to ask yourself "is this worth quitting over" and sometimes it is, if it's unethical and you believe that the company is legitemately not taking into account your perspective then it may be time to move on.
In my poisition this was not a hill I wanted to die on as this was only a small objection that I had, so I began where I knew best - jetbrains tools.
I hope this company is ready for all the love it is about to receieve ❤️
Jetbrains
I am a massive proponent of resharper, I think it helps tremendously with coding, testings, refactoring. I think if I could work anywhere I would work with this team as the things they are doing are truely amazing.
Jetbrains have a tool called DotMemory that bootstraps your application and creates snapshots of memory and what objects are taking up memory.
Now I have to admit that I was a complete novice with this tool and let me tell you it was pretty daunting, but let's take a bit of a look:

This is the screen that greeted me, and immeditely I was confused. Thankfully the team has produced a sample of how to find a memory leak: https://www.jetbrains.com/help/dotmemory/How_to_Find_a_Memory_Leak.html
And trust me I had to read this 100 times to understand what I was looking at:

haha, this particular visualization was on my screen for a entire day, back and fort with the tutorial and the code I was debugging.
So let's talk about what these things mean for a second:
- Survived objects ** These are objects that exist in both snapshots
- New objects ** Objects that exist in the new snapshot but not in the old
- Dead objects ** Objects that exist in he first snapshot but not in the second
Fo now let's roll with this information, this was not the case in the actual use case I had but we can see that the top type of survived objects was Task, hmm, that's a little strange huh?
But how do we know what's going on?
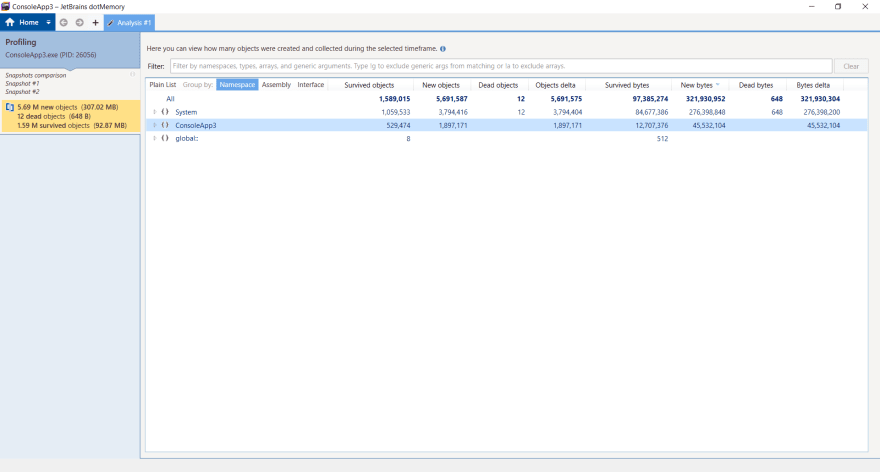
Oh that looks so much better - we have sorted the information by namespace and can see that there are quite a few survived objects in System, that must be the Tasks that we saw before,let's ignore that for now, as this is external to us.
ConsoleApp3 huh? Well that's the name of my application, what's that doing with so many survived objects, lets dig in!
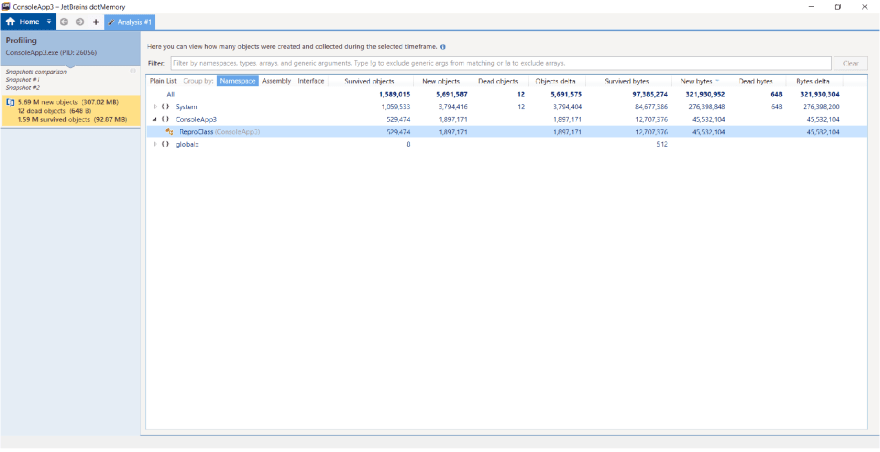
hmm okay so something seems to be happening in something called repro class
We can also get a view that looks like this (if we open the "newer" snapshot
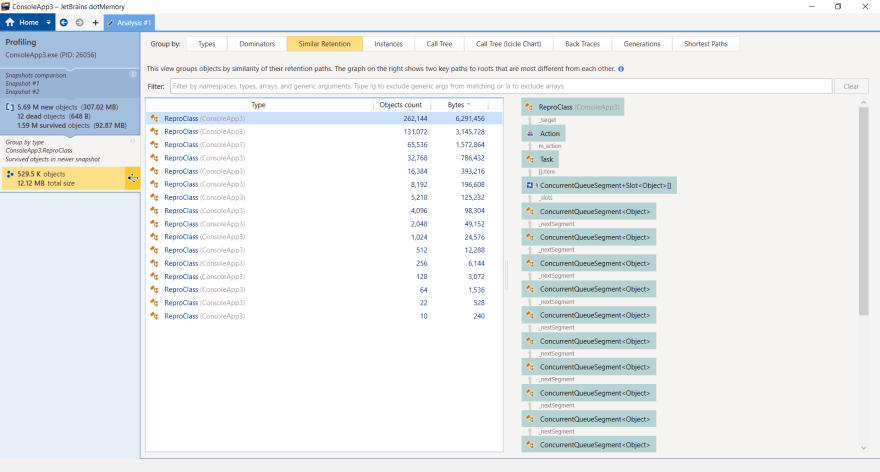
This is where the knowledge of the code comes in.... let's take a peak:
class Program
    {
        static void Main(string[] args)
        {
            var lineFromUser = Console.ReadLine();

            while (!string.Equals(lineFromUser, "quit", StringComparison.Ordinal))
            {
                if (string.Equals(lineFromUser, "repro", StringComparison.Ordinal))
                {
                    var repro = new ReproClass();
                }

                lineFromUser = Console.ReadLine();
            }
        }
    }

    public class ReproClass
    {
        public ReproClass()
        {
            Task.Run(DoBackGroundOperation);
        }

        public void DoBackGroundOperation()
        {
            CancellationToken token = new CancellationToken();
            while (!token.IsCancellationRequested)
            {
                Console.WriteLine("Background op");
                Thread.Sleep(1000);
            }
        }
    }
Okay for people who can see it, this is the most obvious thing in the world. For the sake of everyone else let's step through what is happening:
- We are waiting for a user input
- if the input is "repro" then we are creating an instance of a class
- If the input is "quit" then we exit the program
- we wait for another input
But if we look at the Repro class we see that is has quite a weird constructor, it produces a background thread.
So every time we create a repro class we create another background thread and never get rid of it!!
What can we do?
Cancellation tokens are king here
A CancellationToken enables cooperative cancellation between threads, thread pool work items, or Task objects. You create a cancellation token by instantiating a CancellationTokenSource object, which manages cancellation tokens retrieved from its CancellationTokenSource.Token property. You then pass the cancellation token to any number of threads, tasks, or operations that should receive notice of cancellation. The token cannot be used to initiate cancellation. When the owning object calls CancellationTokenSource.Cancel, the IsCancellationRequested property on every copy of the cancellation token is set to true. The objects that receive the notification can respond in whatever manner is appropriate.
So we can add a token to our thread :D and make our class disposable:
public class ReproClass: IDisposable
    {
        private readonly CancellationTokenSource _source;

        public ReproClass()
        {
            _source = new CancellationTokenSource();

            Task.Run(DoBackGroundOperation, _source.Token);
        }

        public void DoBackGroundOperation()
        {
            CancellationToken token = new CancellationToken();
            while (!token.IsCancellationRequested)
            {
                Console.WriteLine("Background op");
                Thread.Sleep(1000);
            }
        }

        public void Dispose()
        {
            _source?.Cancel();
            _source?.Dispose();
        }
    }
Now when the garbage collector comes along the token will cancel the background thread and we will no longer get the memory issues we were getting before.
Let's look at the graph
If you look at the right hand of the graph after we implemented this fix you can see that it is no longer increasing in memory.
We're done!
Thank you for reading, I hope you learned something, thi was a lot of fun to work on but it gave me multiple headaches
and thank you Jetbrains, I know no one from their team will ever read this blog post, but your tools are amazing!

Top comments (2)
Loosing or Losing?
Yes 😂