
There is times when we are needed chart on a part of Web page or needed to save business analytic image to storage in daily or monthly. Also we wanna manage that images on AWS S3 for historical purpose.
At this point, ChaosGraph library is very useful tool for it.
We are going to review a use-case for these purpose using with AWS infrastructure e.g. API-Gateway, Lambda, S3...
A use-case what we do is down below.
Scenario
We need to create chart image to AWS S3 bucket requested from AWS API Gateway. To do this, API Gateway is received JSON as chart data values by REST request and AWS Lambda be triggered to build a chart image and create a chart image file at temporary directory, and than it will be putting the chart image file to S3 bucket.
Now let's dive in.
We are going to make JSON descriptor file that describes configuration and numerical data for target chart. See down below.
{
  "GRAPH" : "LINE",
  "INTERPOLATE" : "SPLINE",
  "WIDTH" : 1600,
  "HEIGHT" : 900,
  "XINDEX" : ["0", "", "2", "", "3", "", "4", "", "5", "", "6", "", "7", "", "8", "", "9", "", "10"],
  "YINDEX" : [50, 80, 500],
  "ELEMENTS" : [
      {
        "ELEMENT" : "Kafka",
        "LABEL" : "Kafka usage",
        "COLOR" : [180,130,130],
        "VALUES" : [44, 35 , 0, 32, 0, 33, 29, 43, 25, 22, 32, 43, 23]
      },
      {
        "ELEMENT" : "elastic search",
        "LABEL" : "elastic search usage",
        "COLOR" : [180,130,130],
        "VALUES" : [43,25,10,32,0,23,52,32,32,23,54,23,48, 20, 60, 140, 500, 10]
      },
      {
        "ELEMENT" : "Oracle",
        "LABEL" : "Oracle usage",
        "COLOR" : [180,180,140],
        "VALUES" : [500,93,0,49,0,24,93,63,92,84,69,46,28]
      },
      {
        "ELEMENT" : "S3",
        "LABEL" : "S3 usage",
        "COLOR" : [150,200,158],
        "VALUES" : [20,36,0,24,22,37,33,54,23,48,53,150,22]
      }
    ]
}
As you can see, this JSON descriptor defined with type of chart, elements attributes, chart's size and interpolation type.
We define this and complete Lambda function. we will deploy Lambda function and configure it's Role and permission. Also API Gateway, S3 as well. And then we request to AWS API Gateway with this JSON via REST PUT method.
Step 1 - Download library
- Download ChaosGraph libray at Github. Visit to https://github.com/9ins/chaosgraph
- Add the library into your project classpath

- Or Set dependency to your build tool configuration file.
Maven dependency
<!-- https://mvnrepository.com/artifact/io.github.9ins/chaosgraph -->
<dependency>
    <groupId>io.github.9ins</groupId>
    <artifactId>chaosgraph</artifactId>
    <version>2.0.0</version>
</dependency>
Gradle dependency
// https://mvnrepository.com/artifact/io.github.9ins/chaosgraph
implementation group: 'io.github.9ins', name: 'chaosgraph', version: '2.0.0'
Step 2 - How to configure IDE tool
To write Lambda function, You need IDE like Eclipse or Visual Studio Code and those be to support build tool like Maven, Gradle etc. For experienced tool of mine, Will use Eclipse and Gradle.
- Dependency setting
apply plugin: 'java'
apply plugin: 'eclipse'

sourceCompatibility = 1.8
version = '1.0.0'
jar {
    manifest {
        attributes 'Implementation-Title': 'aws-lambda-chart',
                   'Implementation-Version': version
    }
}

compileJava.options.encoding = 'utf-8'

tasks.withType(JavaCompile) {
    options.encoding = 'utf-8'
}

repositories {
    jcenter()
    mavenLocal()
    mavenCentral()
    flatDir {
        dirs 'libs'
    }
}

dependencies {
    // Define AWS SDK dependencies
    compile group: 'com.amazonaws', name: 'aws-java-sdk-s3', version: '1.11.883'
    compile group: 'com.amazonaws', name: 'aws-lambda-java-core', version: '1.2.1'
    compile group: 'org.apache.commons', name: 'commons-lang3', version: '3.11'

    // Define ChaosGraph dependencies, downloaded before
    compile files('libs/chaosgraph-2.0.0.jar')
}

jar {
    doFirst {
        from {
            configurations.compile.collect { it.isDirectory() ? it : zipTree(it) }
        }
    }
    exclude 'META-INF/*.RSA', 'META-INF/*.SF','META-INF/*.DSA'
}
As you can see, Upper Gradle build file defines dependencies of AWS SDK and ChaosGraph.
Step 3 - How to code Lambda function
Open your editor at IDE, Create Java class implemented Lambda 'RequestHandler'. It's named 'ChartGeneratorHandler'. Completed code like down below.
package org.chaostocosmos.aws.lambda;

import java.awt.image.BufferedImage;
import java.io.File;
import java.util.Date;
import java.util.Map;

import org.apache.commons.lang3.exception.ExceptionUtils;
import org.chaostocosmos.chaosgraph.Graph;
import org.chaostocosmos.chaosgraph.GraphUtility;
import org.chaostocosmos.chaosgraph.GraphUtility.CODEC;
import org.joda.time.LocalDateTime;

import com.amazonaws.regions.Regions;
import com.amazonaws.services.lambda.runtime.Context;
import com.amazonaws.services.lambda.runtime.LambdaLogger;
import com.amazonaws.services.lambda.runtime.RequestHandler;
import com.amazonaws.services.s3.AmazonS3;
import com.amazonaws.services.s3.AmazonS3ClientBuilder;
import com.amazonaws.services.s3.model.ObjectMetadata;
import com.amazonaws.services.s3.model.PutObjectRequest;

public class ChartGeneratorHandler implements RequestHandler<Map<String, Object>, String> {

    Regions clientRegion = Regions.AP_NORTHEAST_2;
    AmazonS3 s3Client = AmazonS3ClientBuilder.standard().withRegion(clientRegion).build();
    String bucketName = "line.chart.image";

    @Override
    public String handleRequest(Map<String, Object> event, Context context) {
        String response = null;
        LambdaLogger logger = context.getLogger();

        try {
            //Extract body from event
            String requestJson = event.get("body")+"";

            //Create graph object from requested JSON to make chart image.
            Graph graph = GraphUtility.createGraphWithJson(requestJson);
            //Get buffered image from chart.
            BufferedImage bi = graph.getBufferedImage();

            //Save chart image to file in temp directory.
            String fileObjectKey = "line-chart-"+LocalDateTime.now().toString()+".png";
            File imageFile = new File("/tmp/"+fileObjectKey);
            GraphUtility.saveBufferedImage(bi, imageFile, CODEC.PNG);

            // Upload a png image as a new object with ContentType and title specified.
            PutObjectRequest request = new PutObjectRequest(bucketName, fileObjectKey, imageFile);
            ObjectMetadata metadata = new ObjectMetadata();
            metadata.setContentType("image/png");
            metadata.addUserMetadata("title", "line chart");
            request.setMetadata(metadata);
            s3Client.putObject(request);
            response  = new String("{\r\n" +
                    "  \"statusCode\": 200,\r\n" +
                    "  \"headers\": {\r\n" +
                    "    \"Content-Type\": \"application/json\"\r\n" +
                    "  },\r\n" +
                    "  \"body\": {\r\n" +
                    "    \"message\" : \"success\"\r\n" +
                    "  },\r\n" +
                    "  \"isBase64Encoded\": false\r\n" +
                    "}") ;

        } catch (Exception ex) {
            response =  new String("Error:"+ex.getMessage());
            response += ExceptionUtils.getStackTrace(ex);
            logger.log(response);
        }
        return response;
    }
}
And you should export that class to fat jar(included all library dependency) by running Gradle build.
Step 4 - IAM Role creating for the chart image service
Because of handling of API Gateway/Lambda/S3, you have to create a Role to manage Lambda/API Gateway/S3 in IAM service. To do that, you should sign in AWS console and create Role for API Gateway, Lambda and S3.
Created Role like down below.

For the convenience, setting permissions of API Gateway/Lambda/S3 to FullAccess.
Don't forget to ensure that 'Trust Relationship' include above three service.

For detail setting to Lambda and API Gateway with Role, See AWS Documentation.
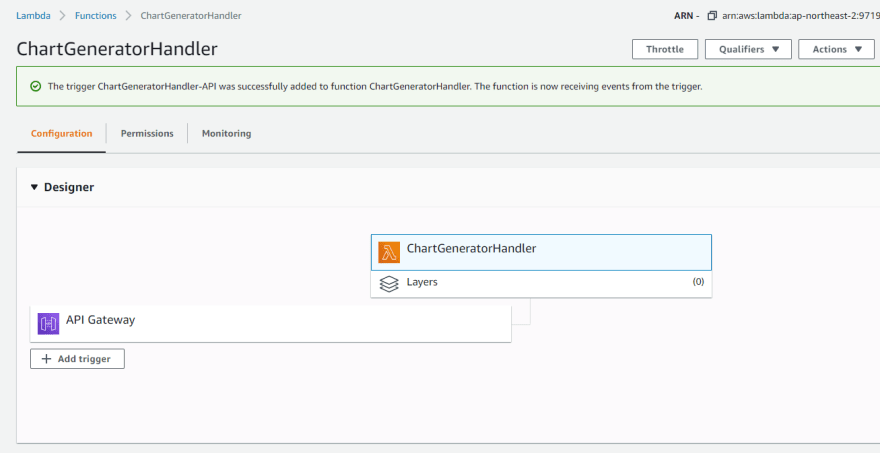
Step 5 - Create Lambda function, Upload jar and Configurations
To deploy your artifact on Lambda, First, you have to create Lambda function and set Role that was created previous step.

Second, Upload your fat jar file to Lambda code section as choosing 'Action' under 'Function code' group on Lambda IDE.

Third, Attach API Gateway on Lambda trigger and then set proper API Gateway configuration and Role.
Util this we done, we can test by configuring Lambda test event menu that be right-upper side of Lambda IDE.
How to try that and Detail configurations of AWS Service, See AWS Documentation.
step 6 - Test with API Gateway
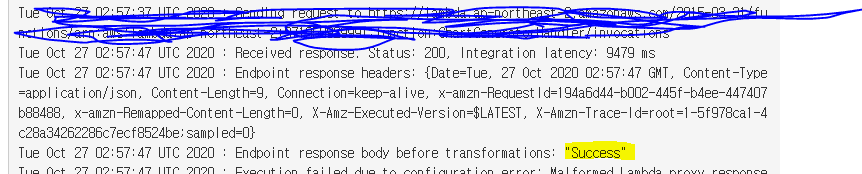
And Now we are going to API Gateway and we can request REST method. Just click 'Test' button.

If all things are fine, You can see like below.
And make sure that line chart image be created on S3.

See created line chart image on browser.
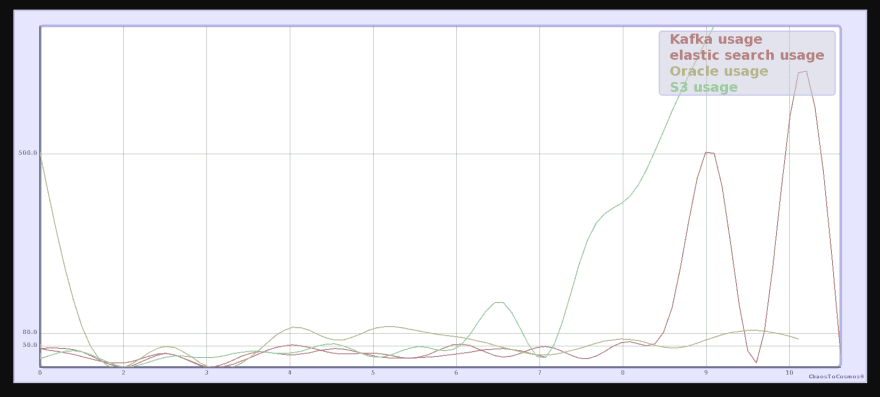
You can try to change JSON descriptor attributes for the more good visual.
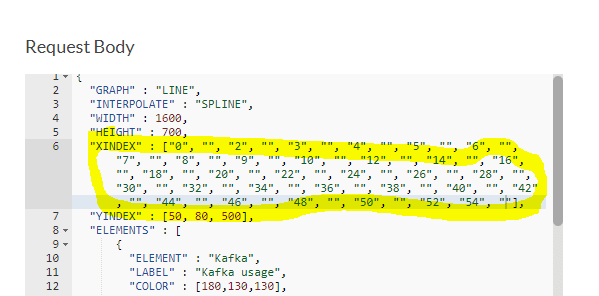
To show more values, added more x axis indexes.

For more the technical challenge, You can add or modify JSON descriptor to include more attribute for dynamic management of service. e.g. Adding S3 bucket name, Adding S3 key prefix...
...
      },
      {
        "ELEMENT" : "S3",
        "LABEL" : "S3 usage",
        "COLOR" : [150,200,158],
        "VALUES" : [20,36,0,24,22,37,33,54,23,48,53,150,22, 300, 400, 600, 800]
      }
    ],
    {"S3-BUCKET" : "line.chart.image"},
    {"OBJECT-KEY_PREFIX" : "line_chart_image"}
}
Conclusion
AWS provide flexible and dynamic services based on it's durable and scalable infrastructures. e.g. Lambda, API Gateway, S3 etc.
ChaosGraph is effective and powerful library to express a chart in Java 2D Graphics.
Thus we were learned how to create dynamic chart image generation for user experience.
This, example could help you to make Web UI/UX or analytic image archive storage... Anything else you wanna place it where you are needed at.
If you are more curious about ChaosGraph, visit Github wiki page : https://github.com/9ins/chaosgraph/wiki or notice to me.

Top comments (0)