Introduction
In Part 5, we implemented the tracing in userd & orderd services. In a distributed system, tracing helps follow a request's journey across services, while metrics play a crucial role in observability by providing visibility into system behavior, performance, and health. In distributed systems, they help with:
- Performance Monitoring – Detect bottlenecks and optimize services.
- Latency Tracking – Identify slow services in request chains.
- Error Detection – Spot failing components before they cause outages.
- Capacity Planning – Predict resource needs to avoid over/under-provisioning.
- Alerting & Troubleshooting – Enable proactive issue resolution.
In this post, we will set up metrics and alerting in our e-commerce system userd and orderd services using Prometheus
Why Prometheus?
Prometheus is one of the best tools for monitoring gRPC-based distributed systems because of its scalability, pull-based model, efficient storage, and powerful query language (PromQL). Here’s why it’s widely used:
- Pull-Based Model for Scalability
- Efficient Storage & Retrieval
- gRPC-Native Support
- Powerful Query Language (PromQL)
- Easy Integration with Alerting & Dashboards
What kind of metrics are we interested in?
- Request Metrics
- Total Requests (grpc_server_requests_total): Number of gRPC requests received.
- Request Rate: Requests per second (RPS).
- Latency Metrics
- Request Duration (grpc_server_handling_seconds): Time taken to handle each request.
- Error Metrics
- gRPC Status Codes (grpc_server_responses_total with labels for status_code)
- Custom Business Metrics
- Login API failure / success counter
- Invalid login attempts counter
- Register API failure / success counter
- Me API failure / success counter
- Create Order API failure / success counter
- Fetch Order API failure / success counter
Integrating Metrics in userd
We updated userd to start an HTTP metrics server that Prometheus can scrape.
Step 1: Configure Prometheus Go Client
We will be using prometheus client to start metrics server as a go routine that can run in background.
This endpoint is then scraped by prometheus.
We will be using go-grpc-middleware for registering the standard metrics of grpc server.
import (
    "github.com/prometheus/client_golang/prometheus/promhttp"
    grpcprom "github.com/grpc-ecosystem/go-grpc-middleware/providers/prometheus"
)

const (
    metricsPort = ":9092"
)

var (
    grpcMetrics       = grpcprom.NewServerMetrics()
)

func main() {
    ....
    // Create a new gRPC server
    server := grpc.NewServer(
        grpc.StatsHandler(serverHandler),
        grpc.ChainUnaryInterceptor(
            grpcMetrics.UnaryServerInterceptor(),
        ),
        grpc.ChainStreamInterceptor(
            grpcMetrics.StreamServerInterceptor(),
        ),
    )

    // Start Prometheus HTTP server
    go func() {
        http.Handle("/metrics", promhttp.Handler())
        log.Println("Prometheus metrics server running on port", metricsPort)
        log.Fatal(http.ListenAndServe(metricsPort, nil))
    }()
}
Note we will have similar change in
orderdservice for server setting in main.go file
Step 2: Define custom metrics for API service for userd service
package service

import "github.com/prometheus/client_golang/prometheus"

const (
    serviceName = "userd"
    component   = "service"

    loginHandlerLabel    = "login_handler"
    registerHandlerLabel = "register_handler"
    meHandlerLabel       = "me_handler"

    successResultLabel         = "success"
    userNotFoundResultLabel    = "user_not_found"
    invalidPasswordResultLabel = "invalid_password"
    userExistsResultLabel      = "user_exists"
    invalidTokenResultLabel    = "invalid_token"
    missingTokenResultLabel    = "missing_token"
)

var (
    // Metrics for login API

    loginMetrics = prometheus.NewCounterVec(prometheus.CounterOpts{
        Namespace: serviceName,
        Subsystem: component,
        Name:      loginHandlerLabel,
    }, []string{"result"})

    registerMetrics = prometheus.NewCounterVec(prometheus.CounterOpts{
        Namespace: serviceName,
        Subsystem: component,
        Name:      registerHandlerLabel,
    }, []string{"result"})

    meMetrics = prometheus.NewCounterVec(prometheus.CounterOpts{
        Namespace: serviceName,
        Subsystem: component,
        Name:      meHandlerLabel,
    }, []string{"result"})
)
Step 3: Call metrics in service handlers
Example: Login service/login.go
// Get user by email
resUser, err := s.DBProvider.GetUserByEmail(ctx, email)
if err != nil {
    if errors.Is(err, gorm.ErrRecordNotFound) {
        loginMetrics.WithLabelValues(userNotFoundResultLabel).Inc()
        return nil, errors.New("user not found")
    }
    return nil, err
}

// Match password
if err := bcrypt.CompareHashAndPassword([]byte(resUser.Password), []byte(password)); err != nil {
    loginMetrics.WithLabelValues(invalidPasswordResultLabel).Inc()
    return nil, errors.New("invalid password")
}

// Generate JWT token
token, err := utils.GenerateJWT(s.JWTSecret, resUser.ID)
if err != nil {
    return nil, err
}
loginMetrics.WithLabelValues(successResultLabel).Inc()
Integrating Metrics in orderd
orderd needs both server-side and client-side metrics calls for grpc userd.
Step 1 remains same as userd service.
Step 2: Add gRPC Client Interceptors
gRPC client interceptor helps in collecting grpc metrics while making call to userd service here.
var (
    grpcClientMetrics = grpcprom.NewClientMetrics()
)

// Create UserServiceClient using grpc
grpcConn, err := grpc.NewClient(
    userServiceURL,
    grpc.WithTransportCredentials(insecure.NewCredentials()),
    grpc.WithStatsHandler(openTelemetryClientHandler),
    // Add gRPC Client Interceptors for Prometheus Metrics
    grpc.WithUnaryInterceptor(grpcClientMetrics.UnaryClientInterceptor()),
    grpc.WithStreamInterceptor(grpcClientMetrics.StreamClientInterceptor()),
)
userServiceClient := user.NewUserServiceClient(grpcConn)
Step 3: Define metrics for orderd services
package service
import "github.com/prometheus/client_golang/prometheus"
const (
serviceName = "orderd"
component = "service"
totalOrdersCreatedMetric = "total_orders"
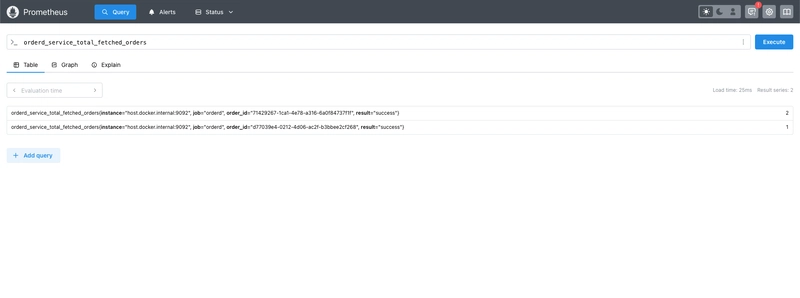
totalFetchedOrdersMetric = "total_fetched_orders"
successResultLabel = "success"
failedResultLabel = "failed"
)
var (
ordersCreatedMetrics = prometheus.NewCounterVec(prometheus.CounterOpts{
Namespace: serviceName,
Subsystem: component,
Name: totalOrdersCreatedMetric,
}, []string{"result"})
ordersFetchedMetrics = prometheus.NewCounterVec(prometheus.CounterOpts{
Namespace: serviceName,
Subsystem: component,
Name: totalFetchedOrdersMetric,
}, []string{"result", "order_id"})
)
Step 4: Example integration of metrics in api services
resOrder, err := s.DBProvider.GetOrderById(ctx, orderID)
if err != nil {
    ordersFetchedMetrics.WithLabelValues(failedResultLabel, orderID).Inc()
    return nil, err
}

ordersFetchedMetrics.WithLabelValues(successResultLabel, orderID).Inc()
Setting Up Prometheus
Step 1: Define Prometheus configurations
Create a file called prometheus.yml with following configurations
global:
  scrape_interval: 5s

scrape_configs:
  - job_name: "userd"
    static_configs:
      - targets: ["host.docker.internal:9091"]

  - job_name: "orderd"
    static_configs:
      - targets: ["host.docker.internal:9092"]
Here we are configuring targets that prometheus will scrape for metrics, note we are using host.docker.internal as we are going to setup with docker, if service and prometheus are on same network you can also use localhost there.
Step 2: Run prometheus using docker
docker run -d --name=prometheus -p 9090:9090 -v $(pwd)/prometheus.yml:/etc/prometheus/prometheus.yml prom/prometheus
Note: we are using the path for above defined prometheus.yml here.
Open http://localhost:9090 in your browser to visualize metrics.
Setting up Alerts using prometheus
Lets try to setup alert for invalid password attempts > 3
Step 1: Create alert_rules.yml
groups:
  - name: grpc_alerts
    rules:
      - alert: HighGRPCFailures
        expr: increase(grpc_client_failed_requests_total[1m]) > 5
        for: 1m
        labels:
          severity: critical
        annotations:
          summary: "High gRPC Client Failures"
          description: "More than 5 gRPC client failures detected in the last minute."
Step 2: Create alertmanager.yml
Just a dummy example to setup slack alerts
global:
  resolve_timeout: 5m

route:
  receiver: "slack-notifications"

receivers:
  - name: "slack-notifications"
    slack_configs:
      - channel: "#alerts"
        send_resolved: true
        username: "prometheus"
        api_url: "https://hooks.slack.com/services/YOUR/SLACK/WEBHOOK"
Step 3: Update prometheus.yml
global:
  scrape_interval: 5s

alerting:
  alertmanagers:
    - static_configs:
        - targets: ["host.docker.internal:9093"]

rule_files:
  - alert_rules.yml

scrape_configs:
  - job_name: "userd"
    static_configs:
      - targets: ["host.docker.internal:9091"]

  - job_name: "orderd"
    static_configs:
      - targets: ["host.docker.internal:9092"]
Step 4: Start alertmanager & Restart prometheus
docker run -d --name=alertmanager \
  -p 9093:9093 \
  -v $(pwd)/alertmanager.yml:/etc/alertmanager/alertmanager.yml \
  prom/alertmanager
docker run -d --name=prometheus -p 9090:9090 -v $(pwd)/prometheus.yml:/etc/prometheus/prometheus.yml -v $(pwd)/alert_rules.yml:/etc/prometheus/alert_rules.yml prom/prometheus
Code Links
For complete change log, pls check
Conclusion
We successfully added monitoring and alerting using prometheus metrics and alertmanager to our distributed app
Next Steps:
Explore deploying distributed app on k8s
Stay tuned for the next post! 🚀

Top comments (0)