
Written by Kasra Khosravi✏️
Introduction
Developers spend a lot of time debugging and maintaining current codebases. Understanding different methods of debugging is critical. Some developers still feel comfortable with more manual ways of debugging. There are also a lot of snapshot tools that give you a detailed report of the issues and errors after a certain part of the code runs. Both of these approaches can be beneficial but they are often focused on when the error happens. With the help of debugger tools, we can see how an error has happened.
In this post, we will be examining gdbgui, an extension of gdb, with visual debugging abilities, which will help us debug compiled languages.
What is gdb?
gdb is a very handy tool for debugging compiled languages such as [C](https://en.wikipedia.org/wiki/C_(programming_language), C++, [Go](https://en.wikipedia.org/wiki/Go_(programming_language), Rust, etc. It is available for common operating systems such as Mac, Windows, and Linux. This debugger can help us in several ways such as:
- Getting an overview of program variables and context when the error occurs
- If a core dump, which is the state of memory at a specific time, happens because of a crash or abnormal termination, we can understand what statement of expression caused it
- Stopping on parts of the program that are causing issues while the program is running
- Testing and experimenting with the program while debugging to narrow down or fix the problems
While these are very helpful in our debugging effort, you still need to run the debugging commands in the terminal and might not get a good overview of the context of the program.
What is gdbgui?
gdbgui is another debugging tool that is built on top of gdb. The main difference is that gdbgui exposes a browser-based frontend to developers, so they can add breakpoints, view stack traces, and change the context and parameter values while the debugger is running.
gdbgui architecture
The library takes advantage of WebSockets. Whenever the frontend debugging tool starts, a WebSocket connection is established which is the communication channel between the browser and the backend. After each established WebSocket, the backend starts a new managed gdb subprocess for parsing the output while spawning a separate subprocess for constantly checking for the output from the other subprocess. Finally, it transports the output to the client using the same WebSocket.
Installation
Let us install gdbgui on our machine. As mentioned before, gdbgui can be installed on various operating systems, but it can also run remotely.
There are several ways to install gdbgui on your machine depending on your operating system, but I am going to follow the simplest and most straightforward one. Since this library is reliant on Python 3, you need to be careful in following any of the installation guides as it might interfere with your machine’s global settings.
The best way to install gdbgui is via pipx. This tool lets you install libraries and applications written in Python in an isolated environment while allowing you to run them via shell as globals via shell. This removes a lot of headaches that might happen because of version incompatibility.
Start by running these commands:
// Step 1: Install pipx
python3 -m pip install --user pipx

// Step 2: Add new path in user path
python3 -m userpath append ~/.local/bin

// Step 3: Install gdbgui
pipx install gdbgui

// Or you can run gdbgui without installing
pipx run gdbgui
Debugging using gdbgui
Let us debug a simple C++ program using gdbgui to get familiar with its features.
First, download this repository to your machine, using the dropdown on the right side of the page.

Now, run these commands in the terminal:
// First, enter the directory for C example
cd gdbgui-master/examples/c

// Second, run the command to run the debugger
make
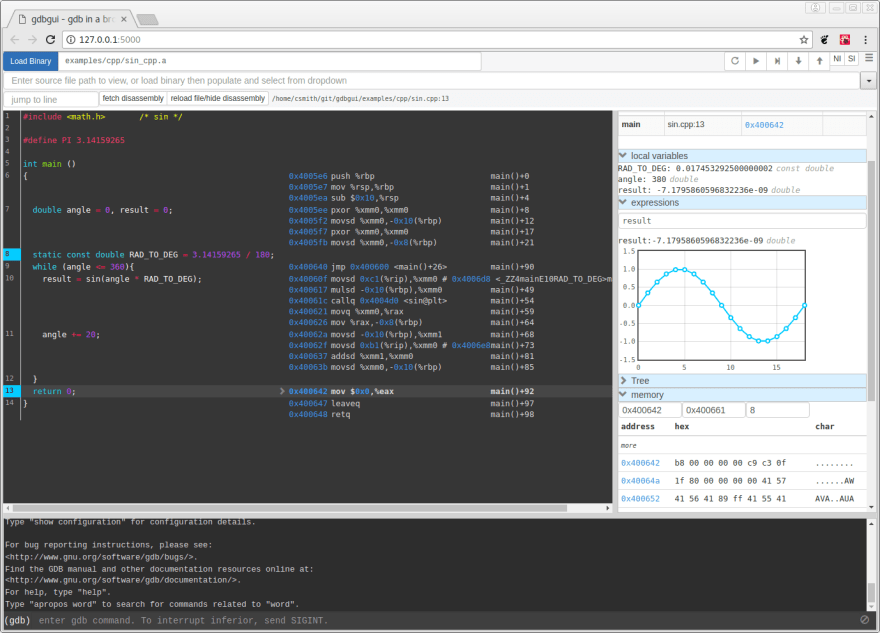
After running these commands, the debugger should pop open in your browser.

At first glance, we see a lot of options on this page. But one thing we need to consider is that the developers of this tool have tried to limit the number of available GUI options, as to lessen the confusion when debugging.
On top of the page, we see a section called Load Binary, which we can use to load program binaries (with a relative path from where the gdbgui is running) and also pass arguments to it like we would in a command line. Please note that this section only accepts executables, so you cannot just pass current executables in your directory without expecting it to be compiled.

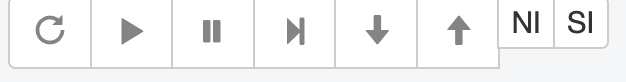
On the right side of the page, we have a controller section which will allow developers to control the general flow of the debugging like restarting a program from the beginning, continuing until the next breakpoint, sending an “interrupt” signal to gdb process for pausing and step over, in, or out of the next functional call. There are also keyboard shortcuts for all of these controls.
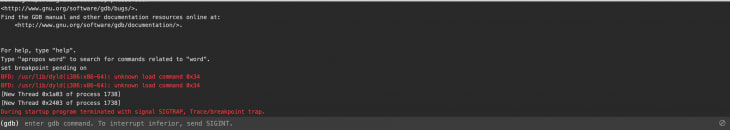
At the bottom of the page, you see an output section that is used to display the output of the program or gdb. It also allows you to run gdb commands in the terminal section.
When you load the executable file, you see the source code with applied breakpoints in the middle of the page. Also, we see a dropdown section that shows a list of all the source files that were used to compile the executable. Although it was not a necessary thing to specify the source file in the dropdown menu, for some debugging scenarios like Rust, you might need to guide gdbgui by entering the name of the main source file in the dropdown section and select it.

On the right side, you see a few panels as well. The call stack section shows where in the stack we are on a certain breakpoint (file and instruction address, which is the pointer in code pointing to the breakpoint). We can also explore the local variables related to attacked breakpoints. Additionally, by clicking on any of the locales here we can see a detailed tree view that can show complex relationships between variables in a visual format.

We also have an expression section where we can watch a certain value persistently through the lifetime of a program. This will be interesting to use for a variable that is expected to change in different sequences of the program.
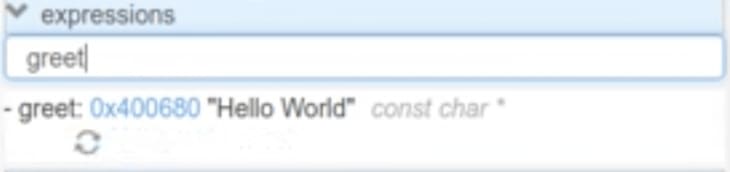
One cool feature about the debugger is that it turns memory addresses into hyperlinks so you can click on them. When that is done, you can see all the memory addresses in a data table and recognize which character they refer to.

An additional visual feature that sets this debugger apart is the ability to monitor the value of certain variables over time on a chart.

If you click on the chart icon in the expression section, you will be shown a graph with both X and Y lines. If the value of the expression changes across the runtime of a debugger, you will be able to see this change visually on the graph. 
Finally, we can explore the settings section of the debugger which is accessible by clicking on the gear icon on the top right of the page. Many of the settings are self-explanatory like adding a breakpoint to main after loading the executable. Also if you leave the option for refreshing components when a command is sent from the terminal, then you will be able to refresh all the visual views after each command (like entering n for the next line of execution). You will also be able to set the theme of debugger here (I personally prefer the darker mode and that is why I am leaving it to be the monokai).
Lastly, you can check the option to print all the commands in the console. Checking this option will show not only all the commands that you run, but it will also display all the commands that gdbgui is running behind the scenes for debugging purposes. In most cases, it is better to have this option unchecked as it will make the terminal console noisy and hard to read.

Conclusion
You can follow the instructions in this guide as well as following the official wiki for gdbgui to test a debugging flow. Such a tool can be particularly helpful for you if you do not have access to a proper IDE debugger tool and would prefer to spin up a visual debugger interface in a matter of seconds and start investigating an issue.
Also, remember that C is not the only language you can debug using this tool. There is support for several languages such as Rust and Go as well. However, there might be small tweaks that you need to make in the debugger environment to make it work for those languages as well. For those scenarios, make sure to check gdbgui’s official documentation to get familiar with the proper setup guide.
Resources
https://www.gdbgui.com/
http://www.cs.cornell.edu/courses/cs312/2006fa/lectures/lec26.html
https://resources.infosecinstitute.com/category/certifications-training/malware-analysis-reverse-engineering/debug-malware-analysis/debugging-basics/#gref
https://www.tutorialspoint.com/gnu_debugger/what_is_gdb.htm
LogRocket: Full visibility into production web apps
LogRocket is a frontend application monitoring solution that lets you replay problems as if they happened in your own browser. Instead of guessing why errors happen, or asking users for screenshots and log dumps, LogRocket lets you replay the session to quickly understand what went wrong. It works perfectly with any app, regardless of framework, and has plugins to log additional context from Redux, Vuex, and @ngrx/store.
In addition to logging Redux actions and state, LogRocket records console logs, JavaScript errors, stacktraces, network requests/responses with headers + bodies, browser metadata, and custom logs. It also instruments the DOM to record the HTML and CSS on the page, recreating pixel-perfect videos of even the most complex single-page apps.
Demo it yourself for free – no account required.
The post Visual debugging using gdbgui appeared first on LogRocket Blog.

Top comments (0)