Overview of My Submission
Schedule metric collectors to gather measurements from different external services and optionally run anomaly detection on the new values.
The project uses MongoDB as a storage system, storing data as time series entries.
To make the experience complete, a visualization tool is needed. Fortunately, Mongo gives us Mongo Charts which can be used directly from Mongo Atlas.
Submission Category:
Prime Time
Link to Code
The code can be found here:
Metric Monitoring App Using Mongo Time Series
Description
Schedule metrics collectors for different services and run anomaly detection on new values.
Getting started
Prerequisites
Make sure you have Docker and Docker Compose installed on your machine.
Create a MongoDB Atlas cluster with MongoDB 5.0 or above installed.
For security reasons, the .env was not included in the repository. The available configuration variables are provided inside .env.sample. Make sure to set all the configuration variables before running the app.
Running the app
Running this app is as easy as running:
$ docker-compose build
$ docker-compose up
Overview
Starting with the docker-compose.yml file, we can see that this application is split into a main webapp service and the scheduling service (celery in this case).
The metrics collection is done mainly by the celery workers. The metrics_web service providing only a way of pushing metrics from external service (when scheduling is…
Additional Info
To test the project, I created three metrics, two of them are randomly generated (as their name suggests) and another one is the number of Dev.to posts in the last 15 minutes (I chose 15 minutes just so I don't have to wait so long for the data).
In the first screenshot, we can see the number of posts in the last 15 minutes and anther graph, plotting the values returned by random.randrange(1, 100)
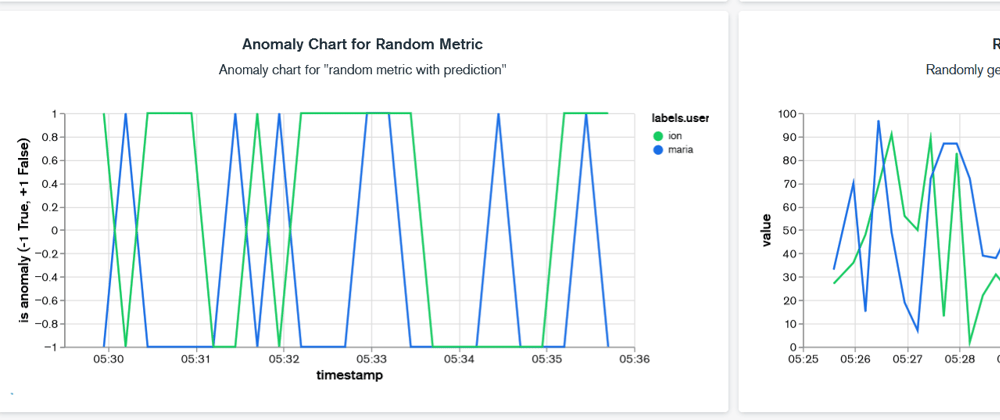
In the second screenshot, we can see the second randomly generated metric (on the right) and a plot of the anomaly prediction (on the left). It is considered an anomaly if the score is -1.
As you can see, due to the metric's randomness and few data points, the anomaly prediction is not giving us any real insight.
Built with
Flask: Flask is a lightweight WSGI web application framework
MongoDB: An open-source NoSQL database developed for high performance, high availability, and easy scalability. It also provides Time Series collections.
Celery: A task queue with focus on real-time processing, while also supporting task scheduling.
Docker: An open platform for developing, shipping, and running applications
scikit-learn: Simple and efficient tools for predictive data analysis


Top comments (0)