
By now you should be familiar with all the steps required to build a machine learning model. If you didn’t get a chance to go through it, feel free to check out this blog, where I explained in detail all the steps required to build and optimize a ML model.
Recap
Steps required to build a model:
Define the Objective, Data Gathering, Data Cleaning, Exploratory Data Analysis (EDA), Feature Engineering, Feature Selection, Model Building, Model Evaluation, Model Optimization, Conclusion
TLDR
In this blog we will implement the first 3 steps on a customer dataset for Churn Prediction.
Outline
- Intro
- Defining the Objective
- Data Gathering
- Data Cleaning
Intro
A Telecom company recently noticed that many of their customers churned unexpectedly. If this continues, the company will incur huge losses. So they immediately worked on a plan to retain their customers.
The company came up with two solutions to solve the issue:
To reduce prices and offer special discounts to all their customers in order to retain the customers who might churn. The problem with this solution is that, giving huge discounts to all the customers may cause losses or the company may produce very little profit.
The company has a huge amount of past data about the customers including the customers who left, so they thought that analyzing their past data may help them predict which customer is likely to churn and if a special offer can retain them.
In hopes to reduce additional losses, the company decided to go with the second solution and approached a data scientist to help them analyze the data and to predict the customers likely to churn.
So without any further delay, let’s dive into the world of data scientists and see how they approach this problem to predict customer churn.
Step 1: Define the Objective
Understand the business
It’s a telecommunications company that provides home phone and internet services to residents in the USA.
Identify the problem
The company noticed that their customers have been churning for a while. And this has impacted their customer base and business revenue, hence they need a plan to retain their customers.
What do they mean by Customer Churn or Churned Customers?
People who stopped using their home phone and internet services are known as churned customers.
Solution
Build a machine learning model to identify/predict the customers who are likely to churn.
As we got a brief idea about what their business is, so let’s start gathering the data.
Step 2: Data Gathering
What kind of data will be required to predict customer churn?
We require customer data, list of services, plans and cost details etc. We can always check with the client what data they have and can always request the client to provide more data as and when required.
Generally data is gathered from multiple resources in real time. Sometimes clients might have some data in their databases, some data might be in their cloud databases, and some data in their API’s etc. All the collected data will be joined and used as a single data resource.
To keep things simple, we'll use an open source dataset Telco Customer Churn for this blog. It’s a fictional dataset created by IBM and is available on Kaggle.
Download the dataset from the above link and save it for further analysis.
Step 3: Data Cleaning
Some Data Cleaning techniques are correcting typos in the data, removing special characters, converting from one data type to another, datetime formatting etc.
Steps to clean data:
- Check how many rows and columns(also known as features) are in the dataset.
- Look for duplicate features by going through the meta info provided.
- Identify Numerical and Categorical features in the gathered data and check if formatting is required or not.
“Formatting means converting the data types of the features, converting the characters from uppercase to lowercase or vice versa, etc.”
We can either use Jupyter notebook or Google Collab to clean the data, analyze the data, and to build and optimize a model.
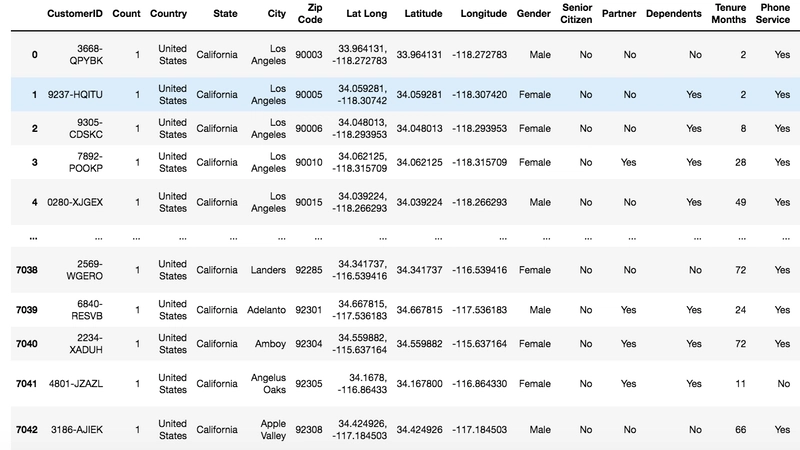 Dataset displayed in a tabular form
3.1. Check how many rows and columns (also known as features) are in the dataset with df.shape().
![]() Shape of Dataset
Shape of Dataset
Observations:
- There are 7043 records and 33 features in the dataset. Note: Records are known as Instances or Rows, Features are known as Variables or Columns.
3.2. Look for duplicate features by going through the metadata provided. First, let’s list out all the columns present in the dataset and then understand each column from the given metadata.
To display the list of columns use df.columns
 List of all columns in the dataset
Metadata: Gives detailed information about the data. The meta information shown below is available on Kaggle where the dataset is also available, hence you can check out the meta info using the same link which we used to download the dataset.

 Meta info
Observations:
- Lat Long looks like a duplicate feature.
Why is Lat Long considered as a duplicate feature?
Based on the meta info, we can see that Lat Long is the same as Latitude and Longitude columns, therefore, we can delete the Lat Long column because there is no point of having the same data with different feature names. Before deletion, we will first take a look at the dataset, cross verify and then delete the Lat Long column.
Note: Duplicate Features/columns are different from Duplicate Records/rows.
3.3. Identify Numerical and Categorical features in the gathered data and check if formatting is required or not with df.dtypes.
 Datatypes of all columns in the dataset
Observations:
There are 9 Numerical and 24 Categorical features.
— If a feature is of int or float data type, then we say that the features are Numerical and if the features are of object datatype or have string values, then we say that the features are Categorical.Numerical Features: The following are numerical features/variables ‘Count’,’Zip Code’,’Latitude’,’Longitude’,’Tenure Months’,’Monthly Charges’,’Churn Value’,’Churn Score’,’CLTV’.
— Looks like Formatting is required for the Zip Code column.
Why: Even though the Zip Code column is in the form of numbers, we cannot consider it as a Numerical type as their values cannot be used meaningfully in any kind of calculations. Therefore, we will convert the Zip Code feature into object data type.Categorical Features: The following are categorical features/variables ‘CustomerID’,’Country’,’State’,’City’,’Lat Long’,’Gender’,’Senior Citizen’,’Partner’,’Dependents’,’Phone Service’,’Multiple Lines’,’Internet Service’,’Online Security’,’Online Backup’,’Device Protection’,’Tech Support’,’Streaming TV’,’Streaming Movies’,’Contract’,’Paperless Billing’,’Payment Method’,’Total Charges’,’Churn Label’,’Churn Reason’.
— Formatting is required for Lat Long and Total Charges columns.
Why: We see that the Lat Long and Total Charges columns are identified as Categorical features which is not true, as based on the meta info we can come to a conclusion that lat long and total charges should be either in the form of integers or floating values but not as string. Therefore, we will convert Lat Long and Total Charges features into either int/float(numerical) data type.
Let’s modify the dataset as per above observations. To do so, first let’s observe few records of the dataset using df.head.
 First 5 records of all columns in the dataset
Observations:
- Lat Long values are the same as Latitude and Longitude column values, therefore we can delete the ‘Lat Long’ column as discussed in Step-3.2.
- Zip Code values are numerical but we should convert them to string as discussed in the above Step-3.2. 3.Total Charges values are numerical and are of float data type, so let's convert this column into numerical.
Modifications
Modifying the dataset based on observations from previous steps
- Removing Lat Long column
df.drop(columns=['Lat Long'], axis = 1,inplace=True) - Changing the data types of Zip Code and Total Charges columns
df['Zip Code'] = df['Zip Code'].astype(str)
df['Total Charges'] = pd.to_numeric(df['Total Charges'], errors='coerce')
Now let’s quickly check if the modifications are done.
print("Total Charges: ",df['Total Charges'].dtype,"\nZip Code: ", df['Zip Code'].dtype)
![]() datatype of Total Charges and Zip code changed after modifications
datatype of Total Charges and Zip code changed after modifications
Let’s take a look at the sample of modified dataset
 Columns after modifications
From the above output you can see that Lat Long is also removed.
We can also remove spaces between the feature names and convert all the feature names into lower case (For eg: Total Charges to total_charges). You guys can take this as an exercise and give it a try.
In order to keep the blog simple, I only showed you the important data cleaning steps necessary for this Telco customer churn dataset.
If we are working with a real time dataset, then at this stage it is recommended to save the cleaned dataset in the cloud databases for future usage. Now this cleaned data can be used for Exploratory Data Analysis.
Conclusion
One should always remember that the way we define the objective, the way we gather data and the way we clean/format the data will vary depending on the requirements and the data we have.
Finally, as a side note, let’s briefly understand the importance of Churn Prediction.
The pillars of any company are Customers and Employees, and it’s always expensive to acquire a new customer or to hire a good employee. Therefore, companies always find ways to retain their customers and employees. Churn Prediction is one such strategy which helps the companies to understand their customers and employees needs and behaviors which helps them to take necessary precautions to retain their customers and employees(by making use of employees data). Hence, we can say that churn prediction is always an important strategy that every company should consider.
That’s it for this blog. Next in this series, we will see how to perform Exploratory Data Analysis (EDA) on the cleaned dataset, so stay tuned!!
Thanks for reading!!

Oldest comments (1)
A very common and high value use case for ML.