
TLDR
Is your model performing better than expected? Double-check if there’s data leakage that is inflating the accuracy and incorrectly evaluating your model performance!
Glossary
- What is it?
- 3 ways to identify
- Coding example 👩💻
- Magical no-code solution ✨🔮
What is it?
Data leakage is like when a teacher accidentally puts exam questions directly on the study guide and then lauds their own teaching abilities when the students perform well– it defeats the purpose of evaluating a student’s understanding of concepts.
Likewise, data leakage refers to accidentally leaking information that a user wouldn’t have access to into the training dataset. Including this extra information often improves the performance when you’re testing, but now the model wouldn’t actually be useful for predictions in the real world because it uses data we wouldn’t know at the moment and causes a biased distribution of data.

Yes, it indeed sounds like a joke that in order to improve your model’s performance, you must simulate what data we have access to before the moment of prediction in your training data set. To mirror the data you’ll have in the real world when making predictions with the model, we must remove certain columns that are increasing the performance metrics like accuracy, precision, and recall. This is to ensure your model is usable in real life!
The following are common mistakes that people make that result in data leakage.
- Telling the future 🔮-> Predicting whether a user opens an email, maybe from Twilio or Hubspot, by tracking their clicks.
- Including features directly correlated with the target feature (column you want to predict) to calculate your prediction -> Estimating how many students will take a sick leave from school by including their COVID-19 test results.
3 ways to identify
Since data leakage is accidental, what signs should we watch out for that might indicate that we might have leaky data?
 Source: Spider-Man: Into the Spider-verse
Depending on the situation, the following are cases that should make you 🚩suspect 🚩there might be data leakage:
- While performing exploratory data analysis (EDA) we check and and suspect that some columns are directly correlated to the prediction
- Model performance of predicting a value is suspiciously good (ie. above 95%)
- When looking at top features, the prediction is mostly dependent on a couple columns, contrasting with the other columns that have little to no influence in comparison
Coding example 👩💻
In this section, you can follow along the code snippets displayed or switch to our Collab Notebook to simultaneously engage with the code and our content! After all, we learn best by doing. ☺️
 Active Learning (Source: Marcie Hopkins, University of Utah)
In our marketing campaign email dataset, we want to predict whether a user opens an email based on features like the subject and who the user is. First, let’s take a quick look at the dataset:
1 import pandas as pd
2
3 df = pd.read_csv('email.csv')
4 df
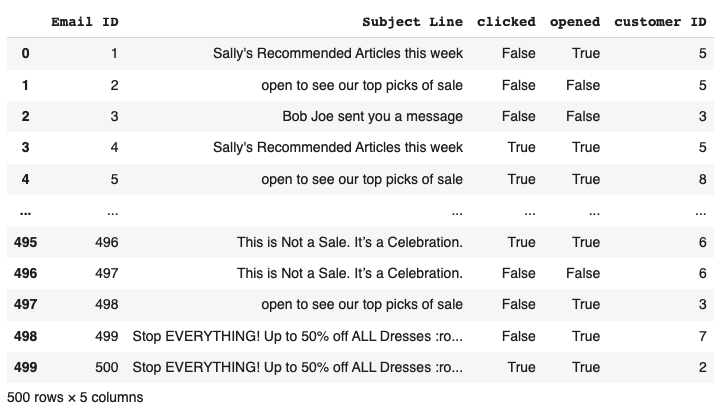
At a glance, we see 500 emails sent to various customers (customer ID). Each row contains the “Subject” of the email, whether users “opened” the email or not, and whether they “clicked” on links within the body of the email.
Although we previously identified that the “clicked” feature is leaky in the above example, what if we weren’t able to detect it?
Data leakage detection
In that case, we can use SHAP values to determine the influence a column has on the outcome of a model. These are essentially a measure of the top features that influence a prediction. When the outcome of a prediction is highly dependent on only a couple features, it is 🚩🚩🚩!
First, we need to train the model. Since we want to predict whether the user will “open” the marketing campaign email or not, we will use a logistic regression model that predicts the likelihood of a boolean outcome.
Before dedicating data into the train and test split, we needed to encode the textual “Subject Line” into numerical values that the regression model understands. You can see how encoding works for this dataset and how we set up the training and testing data in this Colab Notebook.
1 import sklearn
2 from sklearn.linear_model import LogisticRegression
3
4 reg_log = LogisticRegression()
5 reg_log.fit(X_train, y_train)
With our regression model “reg_log” trained, we can now generate our SHAP values and view a bar to see how much one feature influences the outcome compared to the others.
1 import shap
2 explainer = shap.LinearExplainer(reg_log, X_train)
3 shap_values = explainer.shap_values(X_test)
4
5 shap.summary_plot(shap_values, X, plot_type='bar')

From this bar graph, we can see that the “clicked” column has disproportionately more influence on the prediction than the other columns! Our intuition about the correlation between “clicked” and “opened” confirms this insight. You have to “open” the email first before “clicking” on links or highlighting text within the email, so this is definitely a case of data leakage.
Fortunately for us, the hardest part of handling data leakage is the identification step. The solution is simple– we remove the leaky columns!
First, we need the column names so we know what to remove:
1 # print column names
2 list(df.columns.values)
After we identify the leaky “clicks” columns, we can remove the columns using Pandas.
Therefore, we need to remove the “clicked” column using Pandas’ drop():
1 df.drop(columns=['clicked'])

With this, we have removed the “clicks” feature that is too correlated with the target feature, “opened.”
Magical no-code solution ✨🔮
Although you can identify data leakage on your own, our low-code AI tool, Mage, makes it really easy.
In our Review > Top features page, we include built-in SHAP value visualizations of each feature’s influence on the outcome! This makes it easy to identify whether certain features have significantly more weight compared to the others, and eliminate the hassle of learning the SHAP library to utilize its perks.
As you can see, after training the model, we see that the “clicked” feature has 96% influence on the outcome, which makes us highly suspicious of data leakage.

After you make a new model version, we will also point out and suggest you fix the data leakage and how!

After fixing the data leakage problem, we can then compare what the top features are between the model on the left (without data leakage) with the model on the right (with data leakage):

Although the accuracy and other performance metrics in the new version has plummeted compared to the first model we trained, our lower performing model (Version 4) is actually more usable in real life because it doesn’t use features from the future!
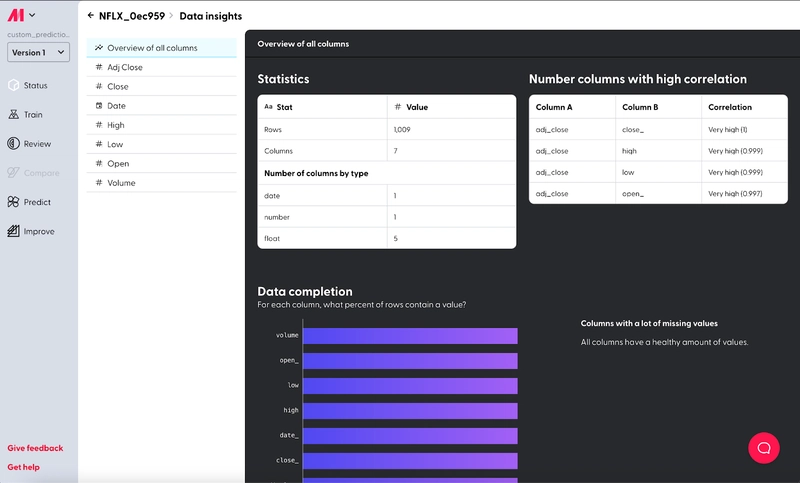
Lastly, if you’d like to identify leaky columns before training, simply select the yellow “View Insights” button during the data preparation process and it’ll bring you to our Automatic data analysis feature.
It can help you identify the columns you have in your dataset, and you can review the list to ensure all of them occur before the prediction.
What’s next 🪄 ✨
Improving models by understanding data leakage is just the beginning. We’ve created a whole series of machine learning tutorials in Mage Academy. From advanced topics like this to more beginner-friendly intros, becoming an AI expert has never been easier. Once you are feeling confident to dive in and start making predictions, you can build your first model.

Top comments (0)