Intro
This time, I will try Chart.js to create some charts.
My base sample codes are as same as last time.
Chart.js has 8 chart types.
This time, I use "line" type.
No options
sample-drawer.ts
...
    private drawSample(canvas: HTMLCanvasElement) {
        const chart = new Chart(canvas, {
            type: 'line',
            data: {
                labels: ['Red', 'Blue', 'Yellow', 'Green', 'Purple', 'Orange'],
                datasets: [{
                    label: '# of Votes',
                    data: [30, 90, 60, 80, 20, 70, 50],
                }]
            }
        });
    }
...
Result

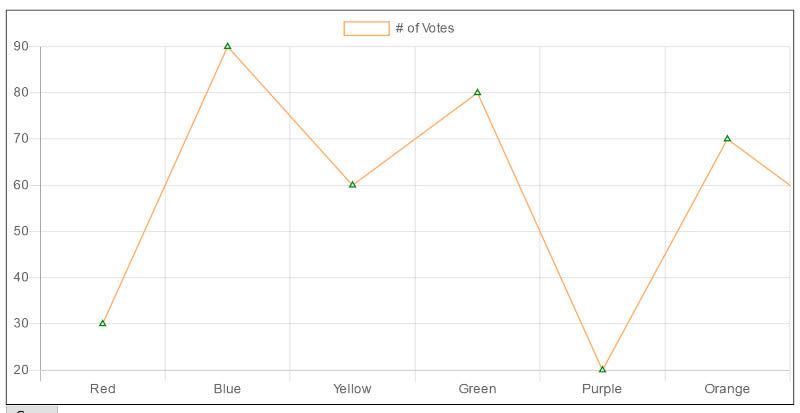
Change styles
I add some codes to change the chart styles.
sample-drawer.ts
...
    private drawSample(canvas: HTMLCanvasElement) {
        const chart = new Chart(canvas, {
            type: 'line',
            data: {
                labels: ['Red', 'Blue', 'Yellow', 'Green', 'Purple', 'Orange'],
                datasets: [{
                    label: '# of Votes',
                    data: [30, 90, 60, 80, 20, 70, 50],
                    // hide the color under the line
                    backgroundColor: "rgba(0, 0, 0, 0)",
                    // line color
                    borderColor: "rgb(255, 170, 100)",
                    pointStyle: 'triangle',
                    // point background color
                    pointBackgroundColor: "rgba(200, 255, 255, 1)",
                    // I also can use color name
                    pointBorderColor: 'green',
                    // default point size
                    radius: 3,
                    pointHoverBackgroundColor: "rgba(100, 170, 100, 0.2)",
                    // hovered point size
                    pointHoverRadius: 7,
                    borderWidth: 1.2,
                    pointHoverBorderColor: "rgb(100, 170, 100)",
                    pointHoverBorderWidth: 2,
                    // make the line straight
                    lineTension: 0,
                }]
            }
        });
    }
...
Result

Offset
How I can start drawing the line from the point where is a little distance from the left edge?
One solution is changing the parent's chart type and set the child's chart type.
sample-drawer.ts
...
    private drawSample(canvas: HTMLCanvasElement) {
        const chart = new Chart(canvas, {
            type: 'bar',
            data: {
                labels: ['Red', 'Blue', 'Yellow', 'Green', 'Purple', 'Orange'],
                datasets: [{
                    type: 'line',
...
                }]
            }
        });
    }
...
Result
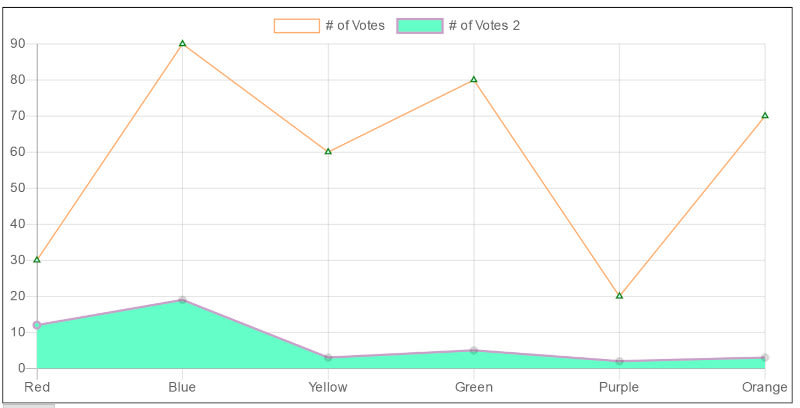
Multiple lines
I can add data to add other lines.
sample-drawer.ts
...
    private drawSample(canvas: HTMLCanvasElement) {
        const chart = new Chart(canvas, {
            type: 'line',
            data: {
                labels: ['Red', 'Blue', 'Yellow', 'Green', 'Purple', 'Orange'],
                datasets: [{
                    type: 'line',
...
                },
                {
                    label: '# of Votes 2',
                    data: [12, 19, 3, 5, 2, 3],
                    lineTension: 0,
                    backgroundColor: [
                        'rgba(100, 255, 200, 1)',
                    ],
                    borderColor: [
                        'rgba(255, 159, 64, 1)'
                    ],
                    borderWidth: 2,
                }]
            }
        });
    }
...
Result
Ignore the point what has no data
If the second line doesn't have the data of 'Green', how can I ignore it?
Though I can set 'null' like below, the line will be broken.
sample-drawer.ts
...
    private drawSample(canvas: HTMLCanvasElement) {
        const chart = new Chart(canvas, {
            type: 'line',
            data: {
                labels: ['Red', 'Blue', 'Yellow', 'Green', 'Purple', 'Orange'],
                datasets: [{
...
                },
                {
                    label: '# of Votes 2',
                    data: [12, 19, 3, null, 2, 3],
...
                }]
            }
        });
    }
...
Result

I can use { x: , y: } to set the graph data.
So if the points what have no data aren't first or last one, I can ignore them.
sample-drawer.ts
...
    private drawSample(canvas: HTMLCanvasElement) {
        const chart = new Chart(canvas, {
            type: 'line',
            data: {
                labels: ['Red', 'Blue', 'Yellow', 'Green', 'Purple', 'Orange'],
                datasets: [{
...
                },
                {
                    label: '# of Votes 2',
                    data: [
                        {x: 'Red', y: 12},
                        {x: 'Blue', y: 19},
                        {x: 'Yellow', y: 3},
                        {x: 'Purple', y: 2},
                        {x: 'Orange', y: 3}
                    ],
...
                }]
            }
        });
    }
...
Result

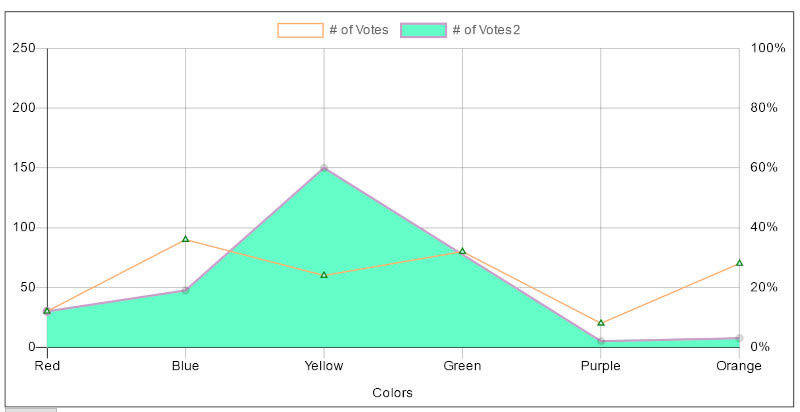
Options
I can add options to set x-axies or y-axies infomations of the graph.
sample-drawer.ts
...
    private drawSample(canvas: HTMLCanvasElement) {
        const chart = new Chart(canvas, {
            type: 'line',
            data: {
                labels: ['Red', 'Blue', 'Yellow', 'Green', 'Purple', 'Orange'],
                datasets: [{
...
                },
                {
                    // use the right side label
                    yAxisID: 'y2',
                    label: '# of Votes2',
...
                }]
            },
            options: {
                scales: {
                    yAxes: [{
                        scaleLabel: {
                            fontColor: "black"
                        },
                        gridLines: {
                            color: "rgba(126, 126, 126, 0.4)",
                            zeroLineColor: "black"
                        },
                        ticks: {
                            fontColor: "black",
                            beginAtZero: true,
                            suggestedMax: 250,
                            stepSize: 50
                        }
                    },
                    {
                        id: "y2",
                        position: "right",

                        gridLines: {
                            display: false
                        },
                        ticks: {
                            fontColor: "black",
                            beginAtZero: true,
                            max: 100,
                            stepSize: 20,
                            callback: function(val) {
                                return val + '%';
                            }
                        }
                    }],
                    xAxes: [{
                        scaleLabel: {
                            fontColor: "black",
                            display: true,
                            labelString: 'Colors'
                        },
                        gridLines: {
                            color: "rgba(126, 126, 126, 0.4)",
                            zeroLineColor: "black"
                        },
                        ticks: {
                            fontColor: "black"
                        }
                    }]
                }
            }
        });
    }
}
Result

Top comments (0)