Understanding Self-Organizing Maps
Self-Organizing Maps are a powerful unsupervised learning tool, particularly in the realm of image classification. Unlike traditional neural networks, SOMs are distinctive in their ability to preserve the topological properties of input data in a lower-dimensional space. This trait allows them to capture intricate relationships and patterns within datasets without the need for labeled data during training, making them specially valuable in exploratory data analysis and pattern recognition.
Architecture and Functionality
SOMs can be represented as a grid of neurons in a lower-dimensional space. These neurons organize themselves in a way that neighboring neurons exhibit similarity in response to input.
During the training process, when an input vector is introduced to the SOM, each neuron calculates its similarity or distance to the input vector. The neuron with the smallest distance or highest similarity to the input vector is identified as the winner neuron.
 [image 1]
Once the winner neuron is determined, the weights of this neuron and its neighboring neurons within a certain radius (according to the SOM's topology) are adjusted to align more closely with the input vector. This process facilitates the self-organization of the map, enabling similar input vectors to be mapped close to each other on the SOM grid.
Advantages and Challenges
The versatility of SOMs lies in their ability to handle complex and high-dimensional data while providing a visual representation of the relationships between inputs. However, the effectiveness of SOMs can be influenced by parameters such as grid size, learning rate, and neighborhood function. Selecting the number of clusters is another challenge that requires a solid understanding of the data.
Datasets
Before jumping into our results, I want to go over the datasets we're using.
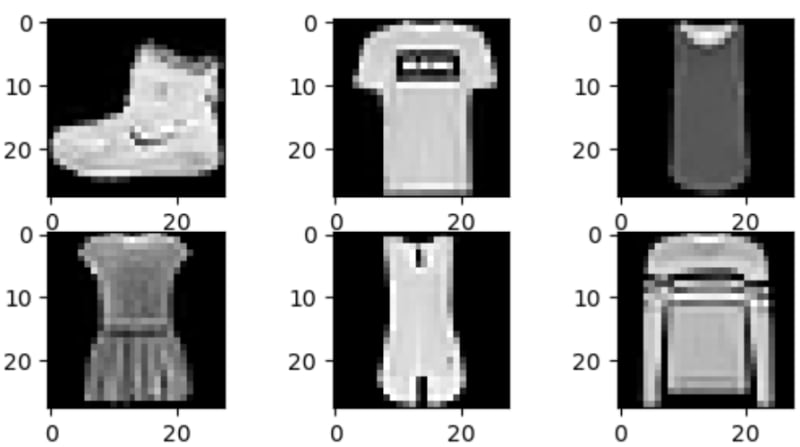
First off we have the Fashion-MNIST Dataset, it's comprised of 70,000 grayscale images, meticulously scaled and normalized. It includes 60,000 images for training and 10,000 for testing, each depicting various fashion items categorized into 10 classes. These images, sized at 28x28 pixels, offer a diverse collection of wearable items, making it a valuable resource for machine learning tasks like image classification and pattern recognition. The dataset's size and organization make cross validation unnecessary, simplifying training.
The classes present are the following:
- T-shirt
- Trouser
- Pullover
- Dress
- Coat
- Sandal
- Shirt
- Sneaker
- Bag
- Ankle Boot
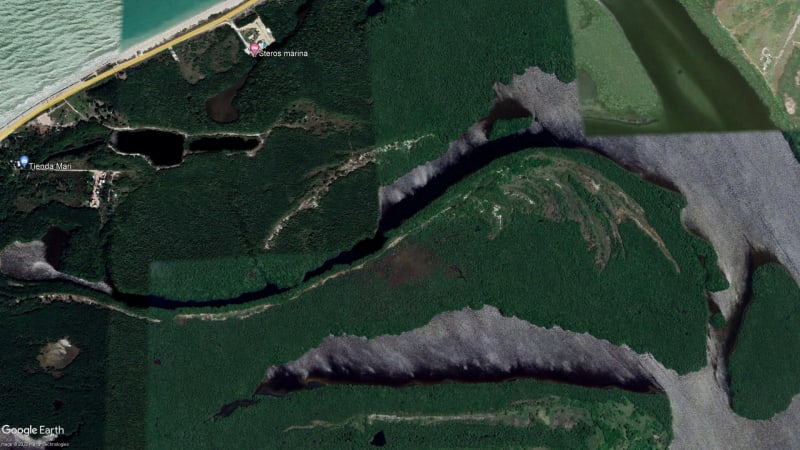
The second dataset has approximately 2,000 high-definition images of different landscapes across Mexico obtained from satellite captures. Each image showcases distinct environmental settings categorized into six classes: Water, Forest, City, Agriculture, Desert, and Mountain. Given that these are HD colored images we need to perform feature extraction in order to train our models. First we resized each image to 128x128 pixels, then we computed the color histograms (RGB) and concatenated them to represent the color distribution in the image. Then we captured texture features in the image by converting to grayscale and computing a Gray Level Co-occurrence Matrix (GLCM). These extracted features are concatenated into a single feature vector for each image along with its class (target variable).
The classes present are the following:
- Water
- Forest
- City
- Crops
- Desert
- Mountain
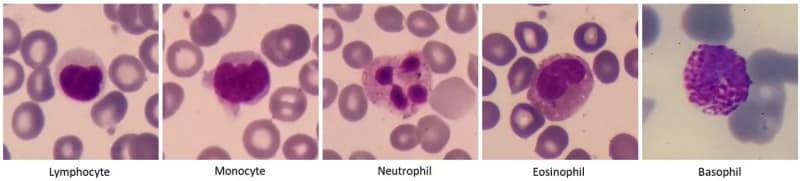
The third and final dataset is comprised of blood images using a microscope, taken by our team with the purpose of classifying the different type of white blood cells present. Given that these images share characteristics with the satellite dataset such as HD resolution and color, we also need to perform feature extraction. In the same way as the satellite dataset, we computed the color histograms and computing the GLCM to create our feature vectors for each image.
The classes present are the following:
- Neutrophils
- Monocytes
- Eosinophils
- Basophils
- Lymphocytes
- Erythroblasts
Results
Blood dataset

We can observe that each group is mostly restricted to its own defined area, which means that the SOM was able to separate each class and differentiate them accurrately using their attributes.

Here we can further observe some of the relationships found amongst the classes, we can see that Erythroblasts (red) occupy some of the space dominated by Lymphocytes (purple) and Monocytes (brown), which indicates that they could be related in terms of their attributes. We also see some overlap between Basophils (blue) and Lymphocytes, which means the SOM found their observations to be similar.
Fashion dataset

We can again observe that each almost all groups are mostly restricted to their own defined area, but now we can see that the SOM mixed 2,4 and 6 in the same areas, which might indicate that the observations in those 3 classes are extremely similar. This makes sense since pullovers, coats and shirts are all garnments worn over the torso and have a very similar shape.

Here we can see even more how the SOM relates these classes, sneakers (pink) and sandals (purple) are practically in the same are which makes sense give that they are both footwear. We can also observe that apart from the aformentioned relationship between pullovers, coats and shirts, shirts (brown) also share area with t-shirts which also makes perfect sense.
Satellite dataset

Here we can see that the SOM struggled a bit more in differentiating between different biomes, this was expected as this dataset is by far the most complex in terms of classifying its images.

We can see that given the area covered, it found some relationship between cultivo (red) and montaña (brown), which makes sense given their brownish color paletts and similar features. It also found close relationship between Agua and Bosque, which might be attributed to their blue/green color palettes.
Conlusions
Throughout the exploration of diverse datasets, including Fashion-MNIST, satellite landscape captures, and blood cell images, SOMs showcased their adaptability in discerning intricate patterns and relationships. The visual representations of SOM grids provided insights into class separations, overlaps, and associations within the datasets, illustrating the SOMs' capability to organize and differentiate data clusters.
By leveraging their ability to find underlying structures within complex datasets, SOMs have proven to be a valuable asset in uncovering hidden insights and patterns, providing enhanced understanding and decision-making in many applications.
References
- Achraf KHAZRI. (2019, August 7). Self Organizing Maps - Towards Data Science. Medium; Towards Data Science. https://towardsdatascience.com/self-organizing-maps-1b7d2a84e065
Images:

Top comments (0)