The hit series Game of Thrones by HBO is popular all over the world. Besides the unexpected plot twists and turns, the series is also known for its complex and highly intertwined character relationships. In this post, we will access the open source graph database NebulaGraph with NetworkX and visualize the complex character connections in Game of Thrones with Gephi.
Introduction to the Dataset
The dataset we used in this article is: A Song of Ice and Fire Volume One to Volume Five[1].
- Character set (vertices set): Each character in the book is stored as a vertex, and the vertex has only one property, i.e. name.
- Relation set (edges set): If two characters connect directly or indirectly in the book, there is an edge between them. The edge has only one property, i.e. weight. The weight represents the intimacy level of the relationship.
The preceding vertices set and edges set constitute a graph, which is stored in the graph database NebulaGraph[2].
Community Detection: The Girvan-Newman Algorithm
We used the built-in community detection algorithm Girvan-Newman provided by NetworkX[3] to divide communities for our graph network.
Below are some explanations for the algorithm:
In the network graph, the closely connected part can be regarded as a community. Connections among vertices are relatively close within each community, while the connections between the two communities are loose. Community detection is the process of finding the communities contained in a given network graph. Girvan-Newman is a community detection algorithm based on the betweenness. Its basic idea is to progressively remove edges from the original network according to the edge betweenness until the entire network is broken down into communities. By removing these edges, the groups are separated from one another and so the underlying community structure of the network is revealed. Therefore, the Girvan-Newman algorithm is actually a splitting method. The algorithm’s steps for community detection are summarized below:
(1)The betweenness of all existing edges in the network is calculated first.
(2)The edge(s) with the highest betweenness are removed.
(3)Steps 2 and 3 are repeated until no edges remain.
With this explanation, let’s see how to use the algorithm.
- Detect communities with the Girvan-Newman algorithm. The NetworkX sample code is as follows:
comp = networkx.algorithms.community.girvan\_newman(G)
k = 7
limited = itertools.takewhile(lambda c: len(c) <= k, comp) communities = list(limited)[- 1]
- Add a community property to each vertex in the graph. The property value is the community number where the vertex is located.
community\_dict = {}
community\_num = 0
for community in communities:
   for character in community:
      community\_dict[character] = community\_num
      community\_num += 1
      nx.set\_node\_attributes(G, community\_dict, 'community')
Vertex Style: The Betweenness Centrality Algorithm
Next we will adjust the size for the vertex and the size for the character name marked on the vertex. We will use NetworkX’s Betweenness Centrality algorithm to achieve our goals.
The importance of each vertex in the graph can be measured by the centrality of it. Different centrality definitions are adopted in different networks to describe the importance of the vertices in the network. Betweenness Centrality judges the importance of a vertex based on how many shortest paths pass through it.
- Calculate the value of the betweenness centrality for each vertex.
betweenness\_dict = nx.betweenness\_centrality(G) # Run betweenness centrality
- Add a new betweenness property for each vertex in the graph.
nx.set\_node\_attributes(G, betweenness\_dict, 'betweenness')
The Edge Size
The size of an edge is determined by the weight of the edge.
Through the preceding process, now our vertices have three properties: name, community, and betweenness. Edges only have one property: weight.
The code is as follows:
import matplotlib.pyplot as plt
color = 0
color\_map = ['red', 'blue', 'yellow', 'purple', 'black', 'green', 'pink']
for community in communities:
nx.draw(G, pos = nx.spring\_layout(G, iterations= 200), nodelist = community, node\_size = 100, node\_color = color\_map[color])
color += 1
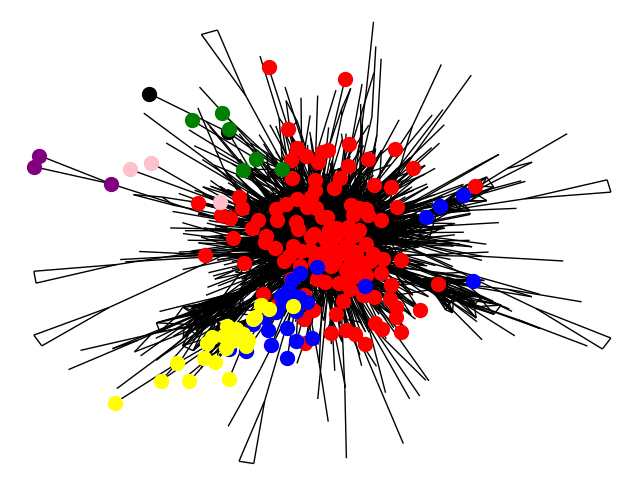
plt.savefig('./game.png')
emmm… not quite good looking.
Although NetworkX itself has many visualization functions, Gephi[4] looks better in interaction and visualization.
Gephi — The Graph Visualization Tool
Now let’s export the preceding NetworkX data as a game.gephi file and import it into Gephi.
nx.write\_gexf(G, 'game.gexf')

Graph Display in Gephi
Open the game.gephi file you just exported into Gephi, and then modify the parameters in Gephi to get a prettier visualized picture.
- Set the Layout to Force Atlas, modify the Repulsion strength to 500.0, and click the Adjust by sizes option to avoid vertices overlap as much as possible.
Force Atlas is a force-guided layout. The force-guided layout method can produce a fairly beautiful network layout and fully demonstrate the overall structure of the network and its automorphic characteristics. The force-guided layout imitates the gravitational and repulsive forces in physics, and automatically lays out until the forces are balanced.

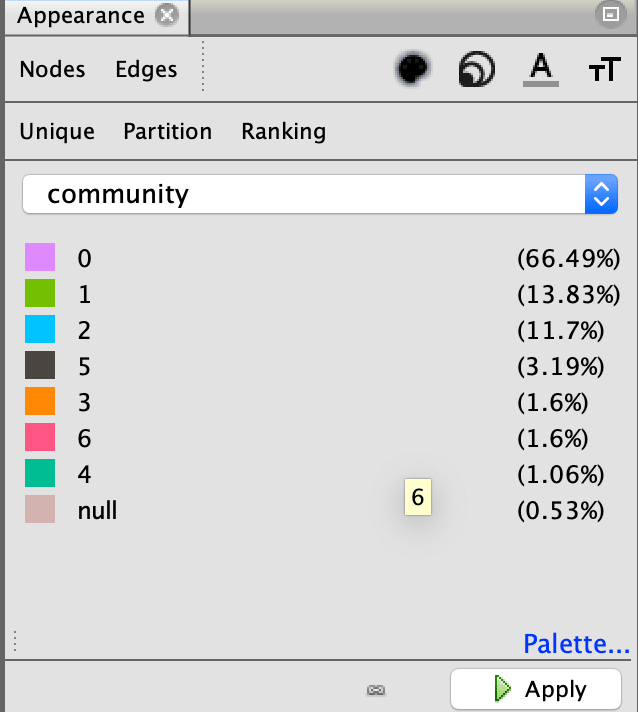
- Color the divided communities.
Select Appearance, Nodes, Color, Partition, and community. The community here is the community number property we just added for each vertex.
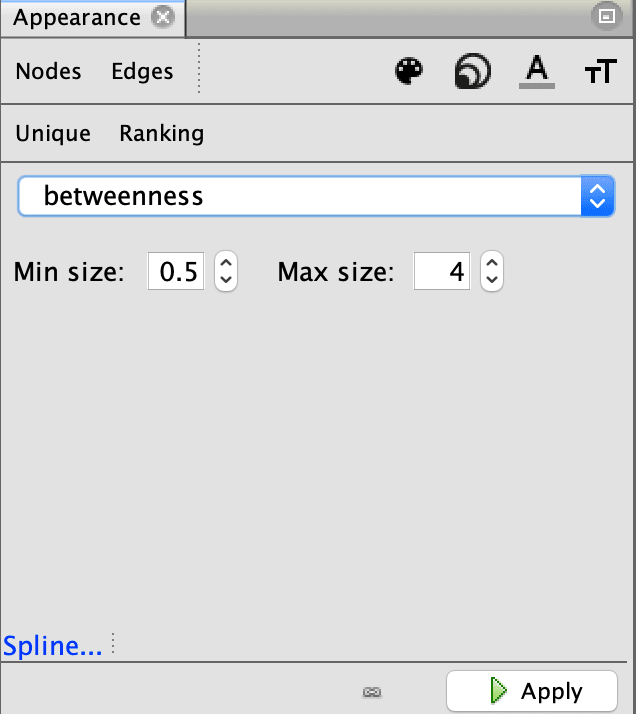
- Set the size for vertices and the character name properties for the vertices.
Select Appearance, Nodes, Size, Ranking, and betweenness. The betweenness here is the betweenness property we just added for each vertex.
- The size of the edge is determined by the weight property of the edge.
Select Appearance, Edges, Size, Ranking, and Weight.

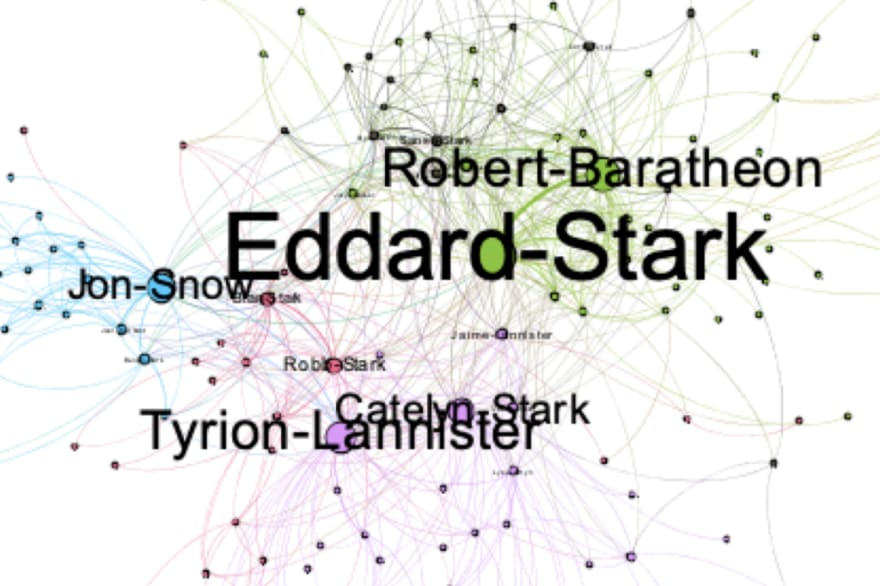
- Export the visualized picture.

Now you’ve got a relationship graph for characters in Game of Thrones. Each vertex represents a character.
What’s Next
This article mainly introduces how to visualize your data with NetworkX and Gephi. Our next article will introduce how to access the data in the graph database NebulaGraph through NetworkX.
The code for this article can be accessed at [5] below.
This article is inspired by [6] below.
References
[2] NebulaGraph GitHub Repository
[3] NetworkX
[4] Gephi
[6] https://www.lyonwj.com/2016/06/26/graph-of-thrones-neo4j-social-network-analysis/
Originally published at https://nebula-graph.io on August 19, 2020.

Top comments (0)