
To read this full New Relic blog, click here.
Applications generally output logs line by line, but occasionally some logs can span multiple lines to make them easier to read. While these multiline logs can improve readability when they're read consecutively (and in isolation), they can be hard to understand when queried among other logs that may appear intermixed. This becomes a problem: logs that are hard to read take up time that could be spent otherwise.
One solution is to combine all the lines from one log message into a single log record. Doing this clearly separates each multiline log, which will in turn make the log easier to understand and you save time. Although consolidating multiline log messages into a single log entry might seem daunting at first, you can do this by creating a log parser based on the common pattern within the log lines. In this post, I’ll walk you through this process. You'll learn how to use a custom Fluent Bit configuration to enable multiline log messages in New Relic logs.
If you're unfamiliar, Fluent Bit is a logging and metrics processor and forwarder. The New Relic infrastructure agent is bundled with a Fluent Bit plugin, so you can natively forward logs with the simple configuration of a YAML file.
If you’re already using Fluent Bit, you can also forward your Kubernetes logs to New Relic with the help of our Fluent Bit output plugin. Alternatively you can use it as a standalone Docker image, which we refer to as our Kubernetes plugin.
Let's get started by understanding the problem a bit better.
The challenge: When multiline logs become hard to read
Take a look at this stack trace as an example. It’s a single log made up of multiple lines. The first line starts with a timestamp, and each new line starts with the word "at".
single line...
Dec 14 06:41:08 Exception in thread "main" java.lang.RuntimeException: Something has gone wrong, aborting!
at com.myproject.module.MyProject.badMethod(MyProject.java:22)
at com.myproject.module.MyProject.oneMoreMethod(MyProject.java:18)
at com.myproject.module.MyProject.anotherMethod(MyProject.java:14)
at com.myproject.module.MyProject.someMethod(MyProject.java:10)
at com.myproject.module.MyProject.main(MyProject.java:6)
another line...
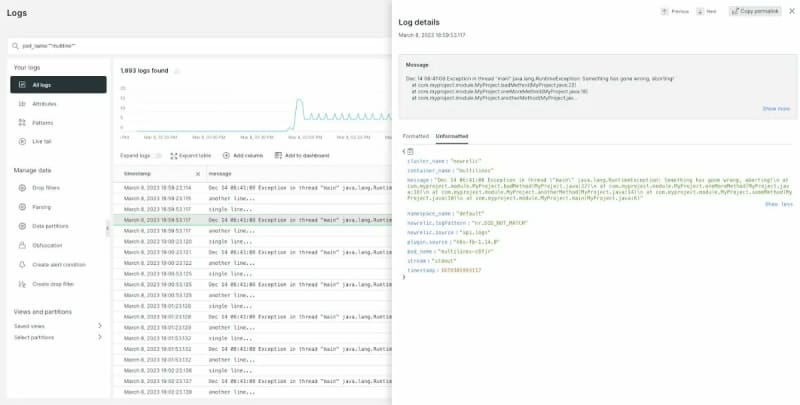
Now, examine how it appears in New Relic without any custom configuration applied. Notice in the next image how each line of the stack trace appears as an individual log entry.

Well that’s precisely the problem: when a single multiline log appears as multiple separate log entries, it makes the multiline log harder to read and to distinguish from other logs.
OK, let’s solve this problem together. To handle multiline logs in New Relic, let's create a custom Fluent Bit multiline parser configuration, using the same logic from the earlier examples.
Ready to follow along?
Sign up for a free account. Your account includes 100 GB/month of free data ingest, one free full-access user, and unlimited free basic users.
Get your New Relic API key.
Start instrumenting with one of our quickstart integrations.
How Fluent Bit processes and parses logs
With Fluent Bit you can gather telemetry data from various sources, apply filters to enhance it, and transmit it to any target location, such as New Relic. All log data ingested by Fluent Bit is automatically labeled, so development teams can easily apply filtering, routing, parsing, modification, and output protocols. Of all the log processors and forwarders, Fluent Bit is highly efficient and well known for being open source and vendor-neutral.
To consolidate and configure multiline logs, you’ll need to set up a Fluent Bit parser. Version 1.8 or higher of Fluent Bit offers two ways to do this: using a built-in multiline parser and using a configurable multiline parser. Together, these two multiline parsing engines are called Multiline Core, a unified functionality that handles all user corner cases for multiline logs.
In this blog post, you'll be using the configurable multiline parser from version 1.8 or higher of Fluent Bit. You'll then be able to apply the parser to a New Relic supported Kubernetes platform, the New Relic infrastructure agent, or you can use Fluent Bit as a standalone Docker image with the New Relic Kubernetes plugin.
Take a moment now to determine which version of tools you are using. Each version of New Relic uses a specific Fluent Bit version, and different versions of Fluent Bit have different features:
In Fluent Bit version 1.7 or lower, you’ll implement multiline log configuration using the old multiline configuration parameters.
In Fluent Bit versions 1.8 or higher, you’ll need to disable any old multiline configuration and instead set up a Multiline Core parser.
Any version greater than the New Relic Fluent Bit output plugin v1.12.2, Helm charts v1.10.9, or infrastructure agent v1.20.3 can use the Multiline Core functionality available in Fluent Bit v1.8 or higher.
To confirm which version of Fluent Bit you're using, check the New Relic release notes.
Creating a custom multiline parser configuration with Fluent Bit
First, it's crucial to note that Fluent Bit configs have strict indentation requirements, so copying and pasting from this blog post might lead to syntax issues. Check the Fluent Bit docs to understand the indentation requirements.
A multiline parser is defined in the parser’s configuration file by using a [MULTILINE_PARSER] section definition, which must have a unique name, a type, and other associated properties for each type.
To configure the multiline parser you must provide regular expressions (regex) to identify the start and continuation lines.
# rules   |   state name   | regex pattern                   | next state
# --------|----------------|---------------------------------------------
rule         "start_state"   "/([a-zA-Z]+ \d+ \d+\:\d+\:\d+)(.*)/"   "cont"
rule         "cont"          "/^\s+at.*/"                            "cont"
The first rule is always referred to as the “start_state”, which is a regex that captures the start of the multiline message. In the earlier example of the New Relic logs, you saw that the multiline log begins with a timestamp and continues to the end of the line.
You set the next state, “cont”, to specify how the potential continuation lines will look. You can give these custom state names and chain them together. In the example in this blog post, the continuation lines start with "at" and are targeted by a suitable regex.
You only need one continuation state for this example, but you can configure multiple continuation state definitions for more complex cases.
Make sure that you have continuation states that match all possible continuation lines. Otherwise your multiline capture might truncate when an unexpected line is encountered.
To simplify the configuration of regular expressions, you can use the Rubular website. This Rubular page shows the regex described earlier—plus a log line that matches the pattern.
Using the custom Fluent Bit multiline parser configuration
Now let’s test this out. My example uses Azure Kubernetes Service (AKS), where I deployed a New Relic Kubernetes integration using Helm. But you can apply a custom Fluent Bit configuration to any supported Kubernetes platform, or you can use it with the New Relic infrastructure agent. You can also use Fluent Bit as a standalone Docker image, which we refer to as our Kubernetes plugin.
To configure Fluent Bit within Helm, we need to make changes to the fluent-bit-config configmap to tell it to apply the parsing.
The first step is to define the correct log parser for input messages. Since I'm using the AKS cluster in this example, I need to define CRI as the log parser. Doing this ensures that each log message is first parsed using the CRI parser, before being handed over to any filters.
[INPUT]
      Name              tail
      Tag               kube.*
      Path              ${PATH}
      Parser            ${LOG_PARSER}
      DB                /var/log/flb_kube.db
      Mem_Buf_Limit     7MB
      Skip_Long_Lines   On
Parser is mapped to the value of the LOG_PARSER environment variable defined in the New Relic logging daemonset. Ensure Parser is set to “CRI” for this test, because AKS uses containerd as the container runtime and its log format is CRI-Log.
Next, within filter-kubernetes.conf add another [FILTER] section, just like in the next code snippet. This filter ensures that each log entry processed by the input log parser is then parsed using our multiline parser.
[FILTER]
    Name              multiline
    Match             *
    multiline.parser  multiline-regex
Next, within parsers.conf configure the multiline parser using the custom Fluent Bit configuration you created earlier. Notice how the multiline parser is matched by name (“multiline-regex”) from the [MULTILINE_PARSER] block in the next code snippet to the [FILTER] block in the previous code snippet.
[MULTILINE_PARSER]
    name          multiline-regex
    type          regex
    flush_timeout 1000


    # rules |   state name  | regex pattern                    | next state
    # ------|---------------|----------------------------------|-----------
    rule      "start_state"   "/(Dec \d+ \d+\:\d+\:\d+)(.*)/"    "cont"
    rule      "cont"          "/^\s+at.*/"                       "cont"
The fluent-bit-config configmap should now look like this.
apiVersion: v1
kind: ConfigMap
metadata:
  name: fluent-bit-config
  namespace: newrelic
  labels:
    k8s-app: newrelic-logging
data:
  # Configuration files: server, input, filters and output
  # ======================================================
  fluent-bit.conf: |
    [SERVICE]
        Flush         1
        Log_Level     ${LOG_LEVEL}
        Daemon        off
        Parsers_File  parsers.conf
        HTTP_Server   On
        HTTP_Listen   0.0.0.0
        HTTP_Port     2020
    @INCLUDE input-kubernetes.conf
    @INCLUDE output-newrelic.conf
    @INCLUDE filter-kubernetes.conf
  input-kubernetes.conf: |
    [INPUT]
        Name              tail
        Tag               kube.*
        Path              ${PATH}
        Parser            ${LOG_PARSER}
        DB                /var/log/flb_kube.db
        Mem_Buf_Limit     7MB
        Skip_Long_Lines   On
        Refresh_Interval  10
  filter-kubernetes.conf: |
    [FILTER]
        Name           multiline
        Match          *
        multiline.parser multiline-regex

    [FILTER]
        Name record_modifier
        Match *
        Record cluster_name ${CLUSTER_NAME}

    [FILTER]
        Name           kubernetes
        Match          kube.*
         Kube_URL       https://kubernetes.default.svc.cluster.local:443
        Merge_Log      Off
  output-newrelic.conf: |
    [OUTPUT]
        Name  newrelic
        Match *
        licenseKey ${LICENSE_KEY}
        endpoint ${ENDPOINT}
  parsers.conf: |
    # Relevant parsers retrieved from: https://github.com/fluent/fluent-bit/blob/master/conf/parsers.conf
    [PARSER]
        Name         docker
        Format       json
        Time_Key     time
        Time_Format  %Y-%m-%dT%H:%M:%S.%L
        Time_Keep    On

    [PARSER]
        Name cri
        Format regex
            Regex ^(?<time>[^ ]+) (?<stream>stdout|stderr) (?<logtag>[^ ]*) (?<message>.*)$
        Time_Key    time
        Time_Format %Y-%m-%dT%H:%M:%S.%L%z


    [MULTILINE_PARSER]
        name          multiline-regex
        key_content   message
        type          regex
        flush_timeout 1000
        #
        # Regex rules for multiline parsing
        # ---------------------------------
        #
        # configuration hints:
        #
        #  - first state always has the name: start_state
        #  - every field in the rule must be inside double quotes
        #
        # rules |   state name  | regex pattern                  | next state
        # ------|---------------|--------------------------------|-----------
        rule      "start_state"   "/(Dec \d+ \d+\:\d+\:\d+)(.*)/"  "cont"
        rule      "cont"          "/^\s+at.*/"                     "cont"
As the final step, you'll need to restart the New Relic logging pods after changing the configuration.
Confirming the custom multiline parser is working correctly
Now within New Relic you can see that the log messages are no longer split across multiple lines and the full stack trace can be seen as part of a single log line.
A seemingly small change like this can have a big impact when you're dealing with multiline logs, and it ultimately makes your debugging experience with logs more effective. Thankfully, this small change is no big deal to implement.
Next steps
If you aren’t already using Fluent Bit, start by enabling log forwarding with the Fluent Bit plugin. Then, you’ll be ready to set up a custom configuration for parsing your multiline logs.
If you're not using New Relic logs yet, sign up for a free account. Your account includes 100 GB/month of free data ingest, one free full-platform user, and unlimited free basic users.
To read this full New Relic blog, click here.

Top comments (0)