Introduction
Clients are implementing migration strategies to transition their legacy systems to cloud and are seeking active-failover solutions for their monolithic applications that operate on multiple ports and are not compatible with load balancing mechanisms.
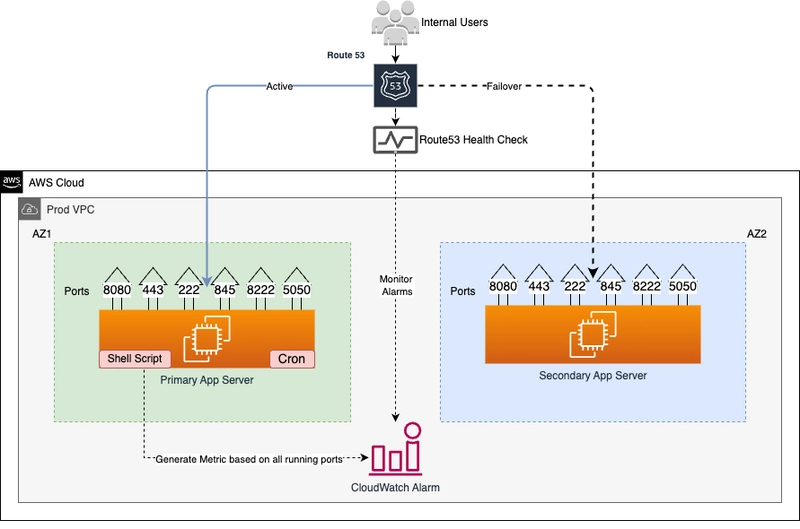
This blog shows a way to build a low-cost active-failover for monolithic, multi-port internal applications using Route53 and CloudWatch. This is only for the application running on multiple ports and wants to failover if any one of the ports goes down.
Prerequisites
- An AWS account with console access administrative previlages
- Route53 Private Hosted zone and Health Check
- CloudWatch Metrics
- Linux EC2 Instances.
Understanding overall design
- Internal users connect to legacy application running on AWS cloud.
- Application has configured in a way to send all traffic to only primary server.
- One small lightweight shell script monitors all running ports inside the primary server and update CloudWatch metrics.
- If any one of the ports goes down, CloudWatch alarm will be triggered and Route53 will re-route whole traffic to secondary server in next 5 minutes.
- Once the primary server start working again, Route53 will route whole traffic back to primary server.
Server and Simple Shell script
- Create IAM Role to update the CloudWatch Metrics
- Primary server must have permission to update the CloudWatch to generate the metrics.
- You may need at least following permissions.
- Assign this role to your servers.
{

    "Version": "2012-10-17",

    "Statement": [

        {

            "Sid": "VisualEditor0",

            "Effect": "Allow",

            "Action": "cloudwatch:PutMetricData",

            "Resource": "*"

        }

    ]

}
- Put the following shell script in root user crontab in the server. Change the instance ID and Ports according to your configuration in the script.
#!/bin/bash

for port in "22" "25" "8080" "80"

do

lsof -i:"$port"  -P | grep IPv4  | grep LISTEN > /dev/null

if [ $? -eq 1 ]; then

   echo "$port is not listening"

   exit

fi

done

aws cloudwatch put-metric-data --metric-name Drives-health --dimensions Instance=i-066111111111100a66 --namespace "Custom" --value 1 --profile <default>
- CloudWatch Alarm configuration
- Shell script will sends health check in form of binary value "1" to the CloudWatch.
- CloudWatch will generate metric based on health-check data.
- Configure a CloudWatch alarm with following conditions and send notification to desired SNS topic.
Section3:Route53 and Health Checks
- Route53 Health Checks
- Create route53 health-check
- Select "state of monitoring alarm"
- Select CloudWatch alarm created in privious step
- Route53 will monitor CloudWatch alarm with this health-check service.
- Route53 DNS Records
- Create A record for your application with failover routing policy.
- While creating primary failover record type, make sure to select health check ID which is created in previous step.
- Do not select any Health check ID while creating failover record type.
Testing
- Access A record url from your browser and check the server receiving the incoming requests.
- Stop any one of the port on primary server, wait for minumum five minutes and access url again.
- All request should route to secondary server.
- You can failback to primary server by starting the stopped port.
Summary
This pattern is for legacy monolithic applications those do not support load balancer and running on multiple ports. I have given very simple method to set up this application which can easily failvoer within five minutes without any AWS load balancer.


Top comments (0)