I wrote a couple of weeks ago about using DuckDB and Rill Data to explore a new data source that I’m working with. I wanted to understand the data’s structure and distribution of values, as well as how different entities related. This week DuckDB 1.2.1 was released and that little 0.0.1 version boost brought with it the DuckDB UI.
Here I’ll go through the same process as I did before, and see how much of what I was doing can be done in DuckDB alone now.
Launching the UI couldn’t be simpler really:
❯ duckdb -ui
-- Loading resources from /Users/rmoff/.duckdbrc
┌──────────────────────────────────────┐
│ result │
│ varchar │
├──────────────────────────────────────┤
│ UI started at http://localhost:4213/ │
└──────────────────────────────────────┘
It opens up a blank page, from which I selected Give me an empty notebook
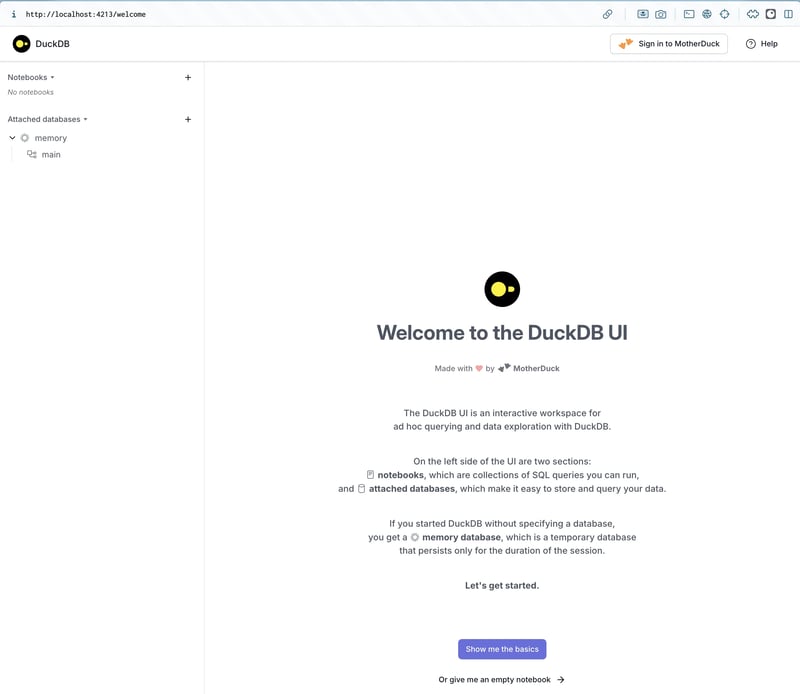
It’s a notebook. If you’re familiar with Jupyter or Zeppelin you’ll be right at home.
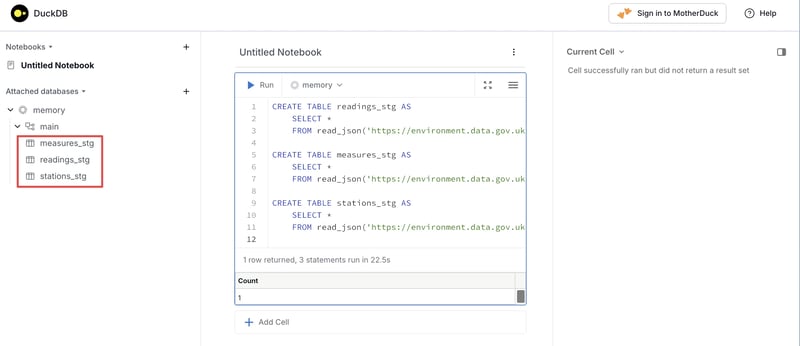
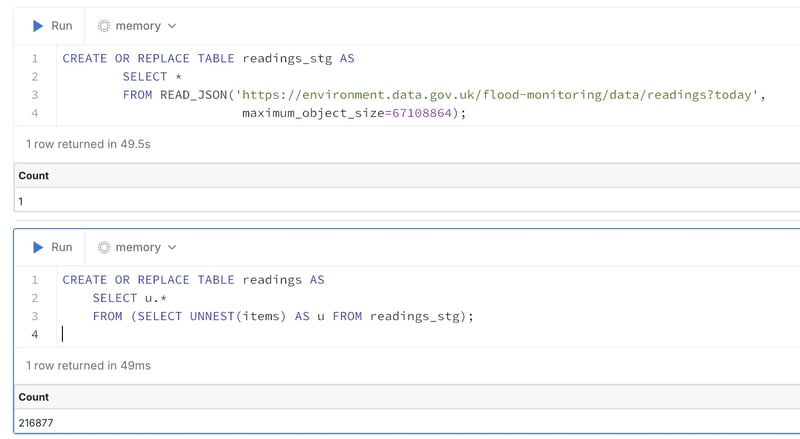
I’ll paste my CREATE TABLE statements in that fetch the data from the API. Press ctrl-enter to run it. All very nice, all very intuitive.
Now I have tables:
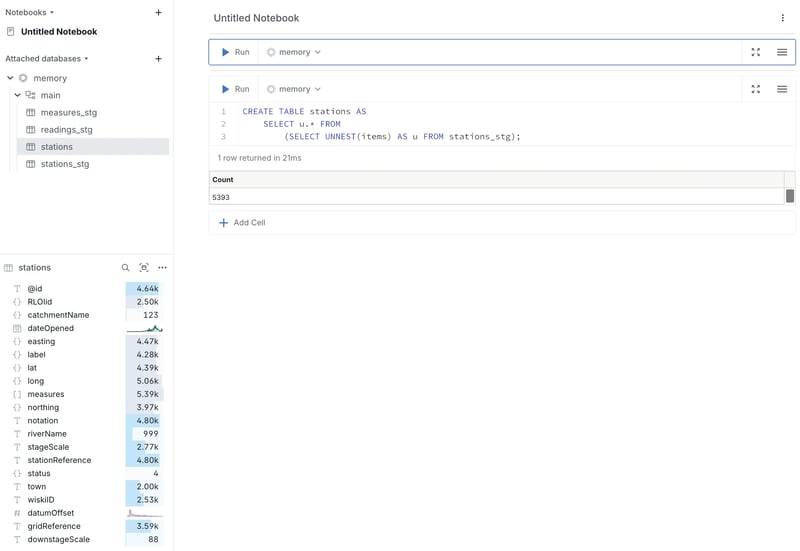
I’ll explode the JSON array into a new table. Note the distribution details of the data in each field for the table.
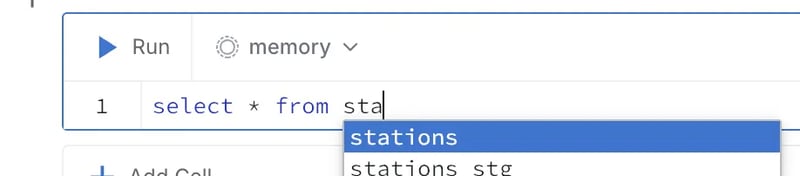
Nice auto-complete (as you’d kinda expect these days anyway—but good to see nonetheless)
Very usable interface for exploring the data
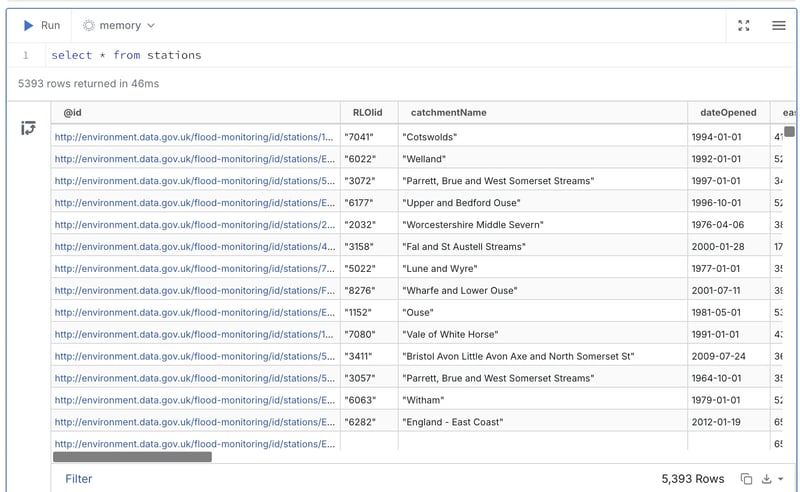
Filtering the returned data is easy, as is changing the order and visibility of columns
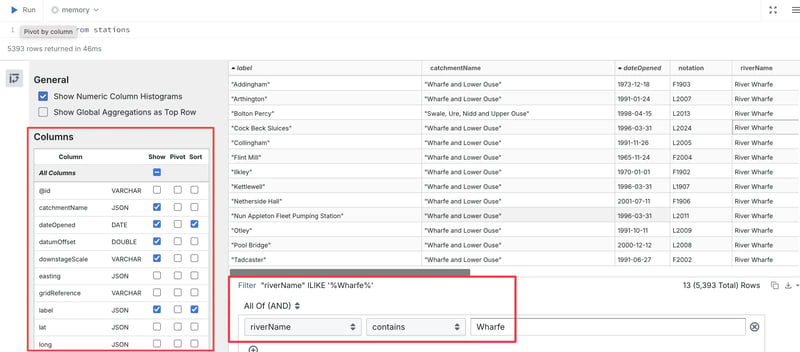
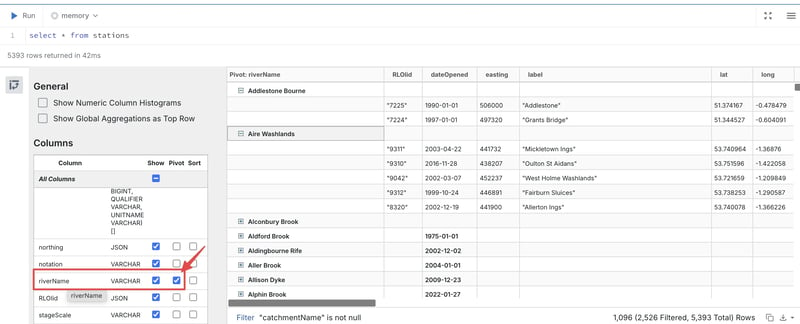
Pivoting is a nice touch for starting to understand hierarchies within the data
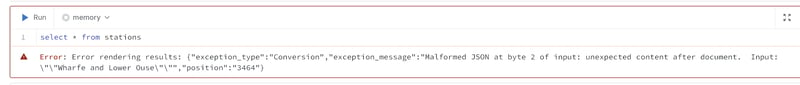
But careful, you can also break things ;)
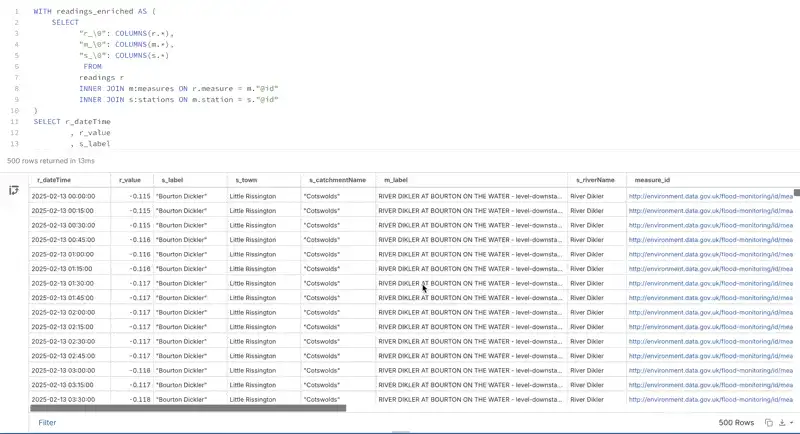
When we join the tables it’s easy to see all the columns. This is what previously had me breaking out of DuckDB CLI and out to Rill Data. With DuckDB UI it’s totally usable for exploring the data:
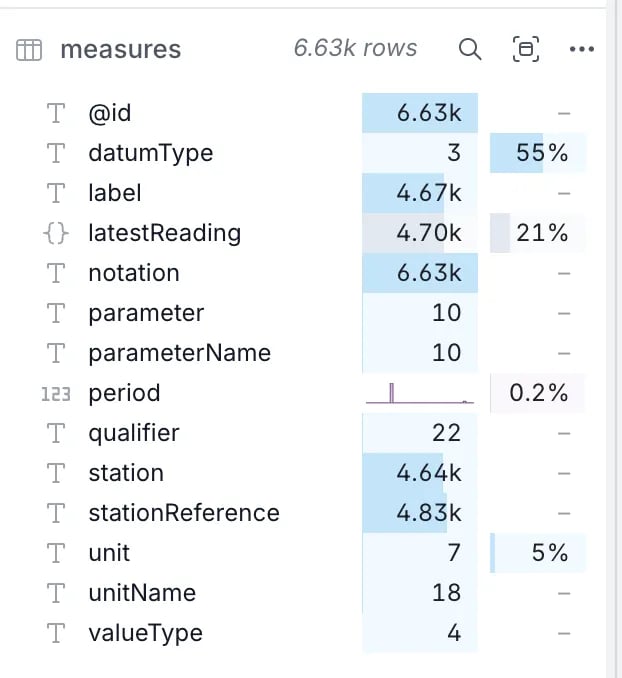
Looking at what I did in Rill I can do easily in DuckDB UI. Here’s the measures table data summary in DuckDB UI:
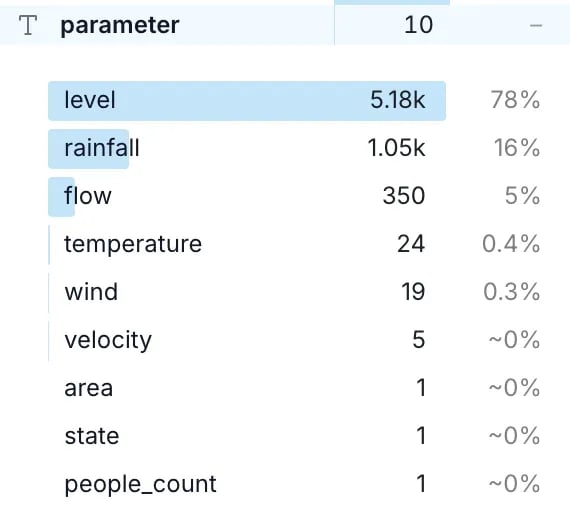
The same column detail is available too:
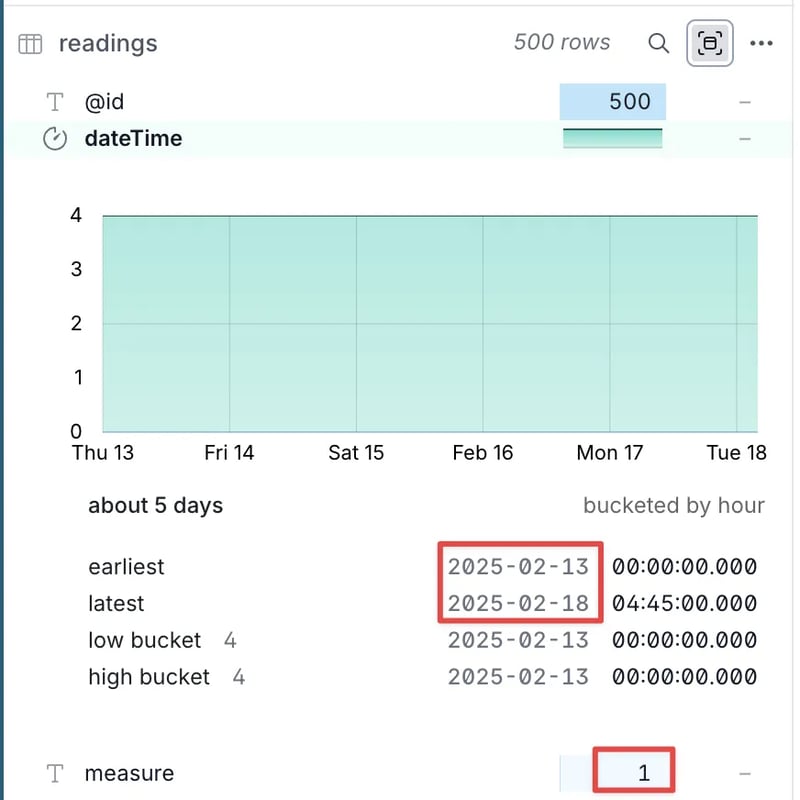
Following on the analysis I did before, I can get the same breakdown of the dateTime field in readings:
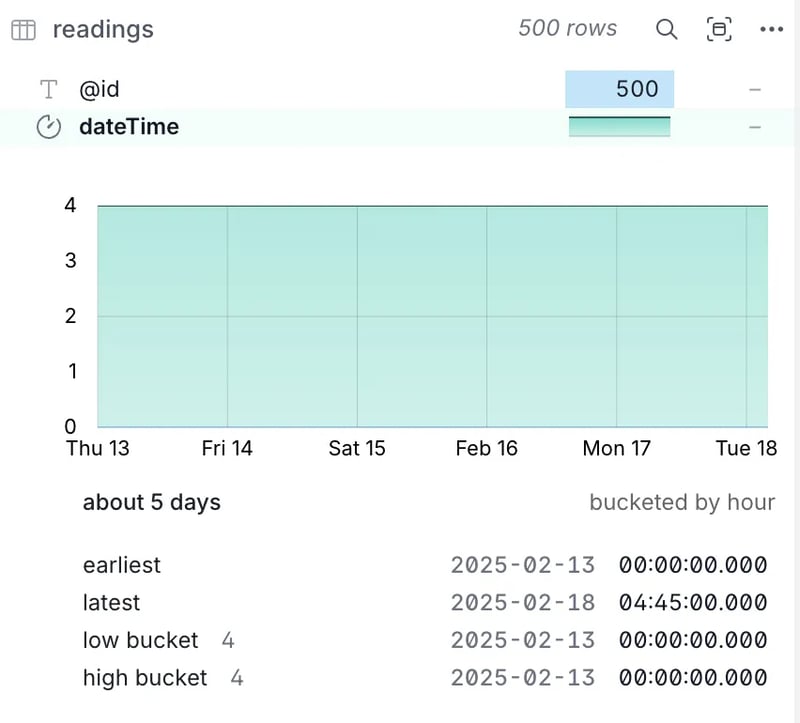
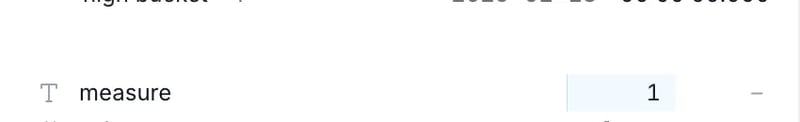
Along with the same cardinality information on the measure field that highlighted I had a problem in my understanding of the API since I only had data for one measure:
What DuckDB UI doesn’t seem to do (yet?) is be able to create a chart on the output of a query; it’s only a flat or pivot table that’s possible. For that, I’d still need Rill, which is what this is taken from:
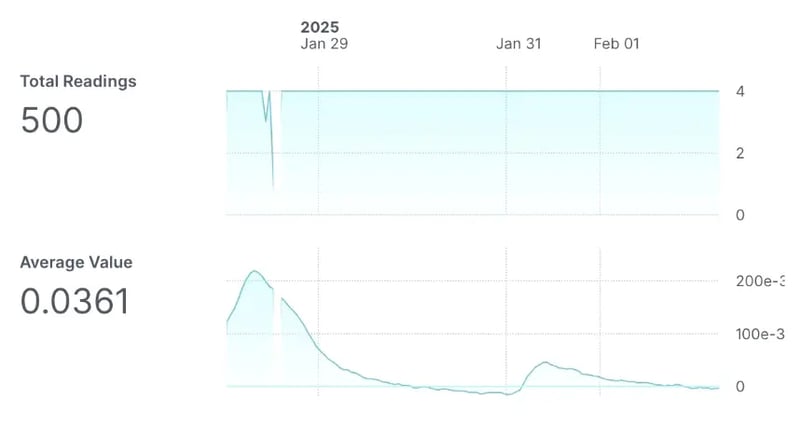
Figure 1. Charting data in Rill Data
So, back to the exploration in DuckDB UI. We’ve realised that we need to pull in more data, so rebuild the readings table using the readings?today API endpoint
It seems the UI maybe has a little bug, because the readings table didn’t update its data summary (even after clicking onto another table and back to readings):
I ended up creating a clone of the table (readings2) and this showed the expected row count and associated data properties:
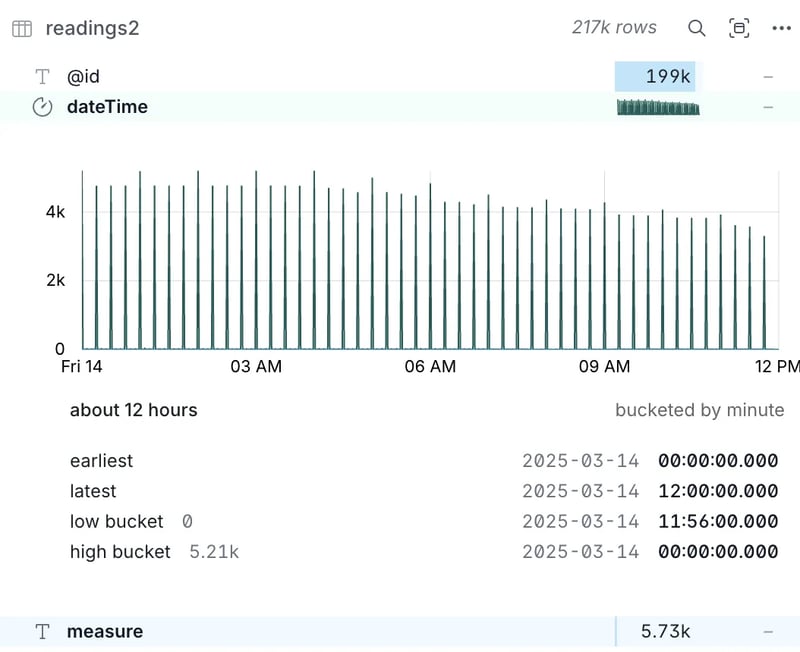
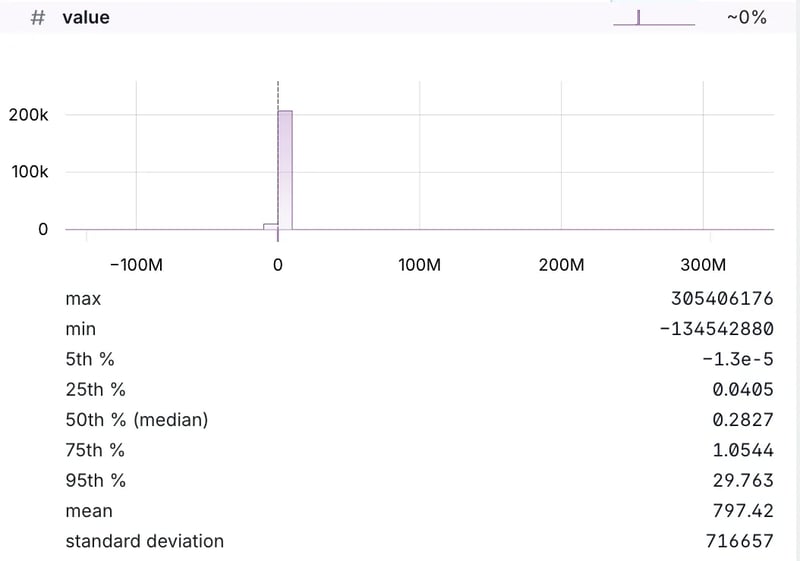
You also get some nice statistical breakdowns of metric fields:
Conclusion
Notebooks are awesome. DuckDB is awesome. DuckDB with embedded notebooks? HELL YEAH!
There’s plenty of scope for development of the DuckDB UI, with things like charting of results and more interactivity over fields (e.g. click a cell and apply a filter on its value). But even at it stands now, it’s a superb addition to an already amazing tool.

Top comments (0)