
Motivation
Some time ago I contributed to OpenRA. OpenRA is an opensource Real-Time strategy game, and one of the most critical operations in this type of games is pathfinding; it needs to work, and it needs to run fast with lots of units moving at the same time each frame. Therefore, it needs to perform well to offer a nice gaming experience to the player.
Precise performance measurement is an activity present in almost every serious project, not necessarily gaming. For a software engineer the optimization part of algorithms and code in general is where this job gets a good name. And it's a task which important to get comfortable with it. In development there is a saying when implementing a feature: make it work, and then make it better.
My main daily driver at work is the python language. In this article I will show you some tools I use and some practical simple usages to get you started quickly on the topic of profiling. However, never miss the opportunity to access the official documentation of the tools exposed to fine tune the profiling to your own necessities!
The example I'm going to use for all the demonstrations
I'm gonna use as base the same example over all the profiling executions I'm going to show in this article. In short, this
is a unit test from my project jumper-py, and it computes, given a map, the shortest path between two nodes:
    def test_astar_intercardinal_search(self):
        map = [
            [0, 0, 0, 0, 0, 0, 0, 0, 0, 0],
            [0, 0, 0, 0, 0, 0, 0, 0, 1, 0],
            [0, 0, 0, 0, 0, 0, 0, 0, 0, 0],
            [0, 0, 0, 1, 0, 0, 0, 0, 0, 0],
            [0, 0, 1, 0, 0, 0, 0, 0, 2, 0],
            [0, 0, 1, 1, 1, 0, 0, 2, 0, 0],
            [0, 0, 0, 1, 1, 0, 2, 0, 0, 2],
            [0, 0, 0, 0, 1, 0, 0, 0, 0, 2],
            [0, 0, 0, 0, 0, 0, 0, 0, 0, 0],
            [0, 0, 0, 0, 0, 0, 0, 0, 0, 0]
        ]

        walkable = lambda v: v != 2

        grid = Grid(map)
        finder = Pathfinder(grid, astar.search, walkable, heuristic=cardinal_intercardinal)
        finder.annotate_grid()

        startx, starty = 0, 0
        endx, endy = 8, 8
        agent_size = 2

        X = 'x'
        marked_map = [
            [X, 0, 0, 0, 0, 0, 0, 0, 0, 0],
            [0, X, 0, 0, 0, 0, 0, 0, 1, 0],
            [0, 0, X, 0, 0, 0, 0, 0, 0, 0],
            [0, 0, 0, X, 0, 0, 0, 0, 0, 0],
            [0, 0, 1, 0, X, 0, 0, 0, 2, 0],
            [0, 0, 1, 1, X, 0, 0, 2, 0, 0],
            [0, 0, 0, 1, 1, X, 2, 0, 0, 2],
            [0, 0, 0, 0, 1, 0, X, X, 0, 2],
            [0, 0, 0, 0, 0, 0, 0, 0, X, 0],
            [0, 0, 0, 0, 0, 0, 0, 0, 0, 0]
        ]

        path = finder.get_path(startx, starty, endx, endy, agent_size)

        self._assert_the_resulting_path_nodes_should_be_like(marked_map, path)
A quick and dirty time measure
Sometimes less is better. A simple time measurement of a function might be more than enough for your needs.
The context manager:
from time import perf_counter, process_time

class timewith:
    def __init__(self, name="operation", cpu_time=False):
        self.name = name
        self.cpu_time = cpu_time
        self.time_func = perf_counter if not cpu_time else process_time
        self.start = self.time_func()

    @property
    def elapsed(self):
        return self.time_func() - self.start

    def checkpoint(self, name=""):
        time = 1000.0 * (self.time_func() - self.start)
        print(f"{self.name} {name} and took {time} ms".strip())

    def __enter__(self):
        return self

    def __exit__(self, type, value, traceback):
        self.checkpoint("finished")
Sample usage:
        [...]

        with timewith():  # The usage of the context manager
            path = finder.get_path(startx, starty, endx, endy, agent_size)

        [...]
Once you execute the test, it will output something like this:
operation finished and took 0.45445101568475366 ms
Quite simple, but as a measurement it can get the job done.
cProfile and Yappi decorators
Yappi and cProfile are what they call "deterministic profilers". The main difference between the two is that yappi supports multithreading execution and CPU measurement besides "Clock wall" measurement. These profilers are very detailed and provide a lot of information of the profiled code. Very useful.
The context manager:
import cProfile
from contextlib import contextmanager
from time import perf_counter, process_time

import yappi

@contextmanager
def profile(filename='results', engine='yappi', clock='wall', output_type='pstat'):
    if engine == 'yappi':
        filename = f'profiling/results/{filename}.prof'
        yappi.set_clock_type(clock)
        try:
            yappi.start(builtins=True, profile_threads=False)
            yield
        finally:
            yappi.stop()
            stats = yappi.get_func_stats()
            stats.print_all()
            stats.save(filename, type=output_type)
    else:
        profile = cProfile.Profile()
        try:
            profile.enable()
            yield
        finally:
            profile.disable()
            profile.print_stats()
            profile.dump_stats(f'profiling/results/{filename}.prof')
Adjust the variables to your own needs. Check the documentation for the respective projects.
Sample usage:
        [...]

        with profile():  # The usage of the context manager
            path = finder.get_path(startx, starty, endx, endy, agent_size)

        [...]
Afterwards, you can visualize the profiling results with a tool like kcachegrind or snakeviz.
Display of the results with kcachegrind:
pyprof2calltree -i profiling/results/results.prof -k
Display of the results with snakeviz:
snakeviz profiling/results/results.prof

Snakeviz is very visual, displaying each function in a different size in proportion to the time spent running it. Even then, I miss the display of more information in the icicle graph like the total number of calls each function performs to another function, like Kcachegrind does. You can refer for these values in the table that Snakeviz prints below the graphic though, but it would had been nice to include them. Maybe a function takes longer to execute not because it's slow per se, but because it's been called too many times unnecessarily, and that thing is not made explicit on the graph. A pity.
This is why I usually use both tools when optimizing code. Snakeviz for having a quick, general overview of the code execution and, if I need more information and call details, I switch to Kcachegrind. I still haven't found the "profiling visualizer to rule them all".
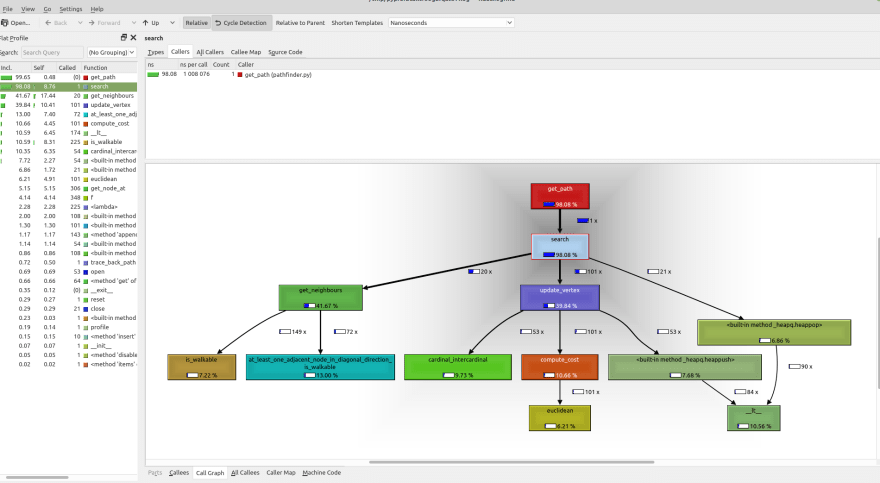
Worth mentioning too, you can use gprof2dot and xdot to have a quick glance at the call tree of your profile function:
gprof2dot -f pstats profiling/results/results.prof -o profiling/results/results.dot
xdot profiling/results/results.dot

PyInstrument
PyInstrument, compared to cProfile or Yappi, it's a lot easier to use and requires much less configuration.
With some small tweaking, we can take the code example from their documentation and write a decorator that we can easily place wherever we need to run this profiling.
The context manager:
from pyinstrument import Profiler


@contextmanager
def instrument(filename='results'):
    profiler = Profiler()
    directory = Path("profiling/results/")
    try:
        profiler.start()
        yield
    finally:
        profiler.stop()
        directory.mkdir(parents=True, exist_ok=True)
        path = os.path.join(directory, f'{filename}.html')
        with open(path, 'w') as fs:
            fs.write(profiler.output_html())
Sample usage (test from my project jumper-py):
        [...]

        with instrument():  # The usage of the context manager
            path = finder.get_path(startx, starty, endx, endy, agent_size)

        [...]
Screenshot of the result:
xdg-open profiling/results/results.html

As you can appreciate, it quickly gives you information on how much time it has spent on each function so you can quickly focus your attention on what is important.
Bear in mind though, pyInstrument does not replace other types of profiling, since it has a lower level of detail than cProfile or Yappi. But it's a really good starting point for your profiling.
Conclusions
Profiling is a crucial skill for any developer worth its salt. Maybe it's not something that you will use every day unless your business has high performance requirements, but it's something you can often rely on when "inexplicably" your application runs slower and you don't know why. And, eventually, you will cross paths which such problems, either in the form of algorithm optimization (like pathfinding algorithms) or in web development, helping you finding out why you're making so many database calls and give you hints on which ORM calls could be optimized.
References
https://uwpce-pythoncert.github.io/Py300/profiling.html#today-s-topics
https://pythonspeed.com/articles/beyond-cprofile/
https://blog.blackfire.io/profiling-101-for-python-developers-existing-profilers-3-6.html

Top comments (0)